You must login before you can run this tool.
Anisotropy Calculator - 3D Visualization Toolkit
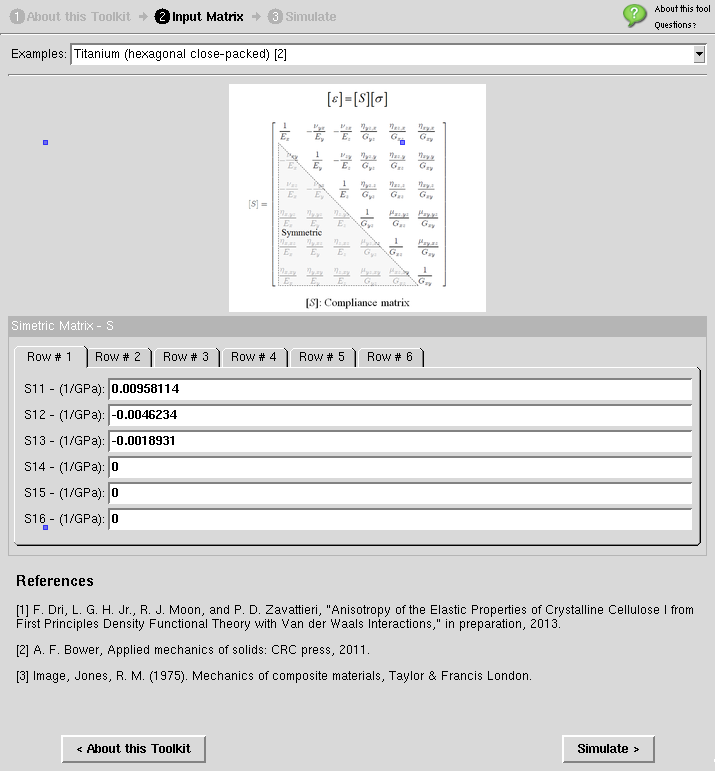
Generates 3D surface contour plot of the Young’s modulus from a compliance matrix (Sij).


Category
Published on
Abstract
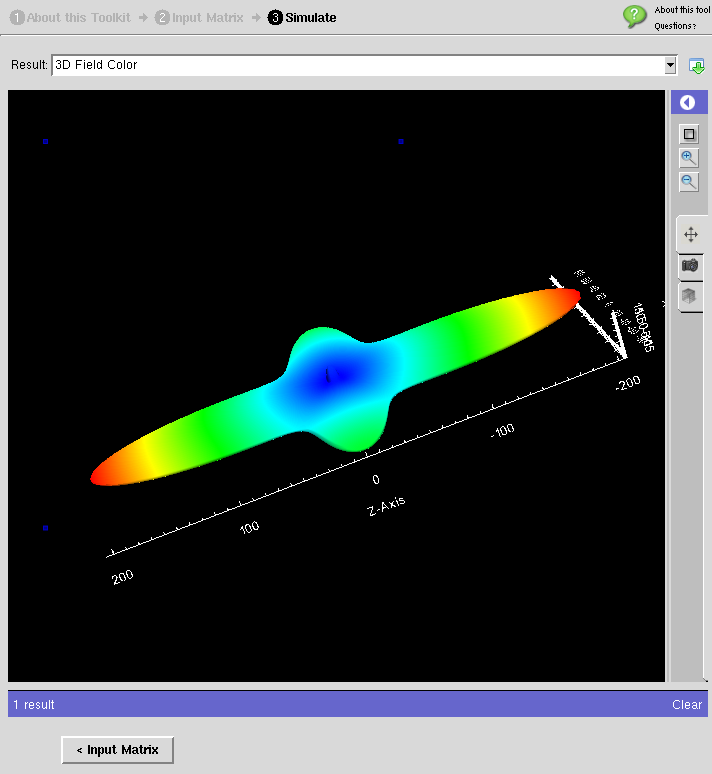
This toolkit produces 3d surfaces showing contours of computed Young’s modulus values based on a given compliance matrix (Sij). Each point on the surface represents the magnitude of Young’s modulus in the direction of a vector from the origin of the surface to that point. The color contours help to identify the Young modulus variation in a given direction.
The tool is capable of generating a 3d countour plot to be manipulated in real time by the user. A Tecplot data file (.dat) is also available for downloading.
References
http://solidmechanics.org/Text/Chapter3_2/Chapter3_2.php
Cite this work
Researchers should cite this work as follows: