
<histogram>
An histogram object represents a set of tabulated frequencies. It shows what proportion of cases fall into specific bins or categories.
Example
<histogram id="example">
<about>
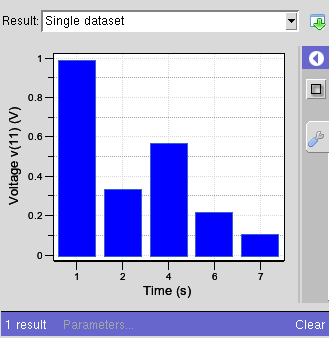
<label>Single dataset</label>
<description>This is an example of a single histogram.</description>
</about>
<xaxis>
<label>Time</label>
<description>Time during the experiment.</description>
<units>s</units>
<marker>
<at>5</at>
<label>Look here</label>
<style>-foreground red -linewidth 2</style>
</marker>
</xaxis>
<yaxis>
<label>Voltage v(11)</label>
<description>Output from the amplifier.</description>
<units>V</units>
</yaxis>
<component>
<xy>
1 0.99
2 0.34
4 0.57
6 0.22
7 0.11
</xy>
</component>
</histogram>
How to describe the data
Each <component> element describes the values of the histogram. There following sub-elements that can be used to describe the data.
- <xy>
- The data is in name/value pairs. The name is a string that will label the bar. The value is the frequency. The order of the bars is the order of the pairs.
   <histogram id="namevalues">
    ...
    <component>
      <xy>
        First 0.99
        Second 0.34
        Third 0.57
        Fourth 0.22
        "Another value" 0.11
      </xy>
     </component>
   </histogram>
- <xhw>
- This is exactly like the <xy> element except that it includes a third value per line that is the width of the bar. The should be used when you want non-uniform bars.
   <histogram id="xhw">
    ...
    <component>
      <xhw>
       1 0.99 1
       2 0.34 1
       4 0.57 2
       6 0.22 1
       7 0.11 1
      </xhw>
     </component>
   </histogram>
The x-value is a string that will label the bar. The y-value is a number representing the frequency. The last value is the width of the bar in graph coordinates.
- <xvector> and <yvector>
- These two elements can be used if you want to represent the data as separate vectors. The x-vector values are the strings representing the labels of the bars. The y-vector values are numbers representing the frequencies. The widths of the bars are uniform.
  <histogram id="vectors">
   ...
   <component>
     <xvector>1 2 4 6 7</xvector>
     <yvector>0.99 0.34 0.57 0.22 0.11<yvector>
   </component>
  </histogram>
Tags
When a histogram is produced as an output result, the following tags are significant:
- <about><label>
- identifies the result in the combobox when selecting various results.
- <about><description>
- is displayed in a tooltip when you mouse over the selector, giving a more detailed explanation of what this result represents.
- <xaxis><description>
- is displayed in a tooltip when you mouse over the x-axis. It gives more information about the physical quantities being plotted.
- <yaxis><description>
- is displayed in a tooltip when you mouse over the y-axis. It gives more information about the physical quantities being plotted.
Note that the <xaxis> sections can have one or more <marker> objects. Each marks an axis value with an optional label.
- <xaxis><marker><at>
- is the location along the x-axis of a vertical line.
- <xaxis><marker><label>
- is the text displayed at the top/right of the vertical line.
- <xaxis><marker><style>
- is a list of style attributes for the vertical line.
- <yaxis><marker><at>
- is the location along the y-axis of a horizontal line.
- <yaxis><marker><label>
- is the text displayed at the above of the horizontal line.
- <yaxis><marker><style>
- is a list of style attributes for the horizontal line.
[Need description of available style attributes.]
Last modified 13 years ago
Last modified on Sep 14, 2011 10:58:09 AM