[Illinois] MCB 493 Lecture 5: Unsupervised Learning and Distributed Representations
[Illinois] MCB 493 Lecture 5: Chapter 5
-
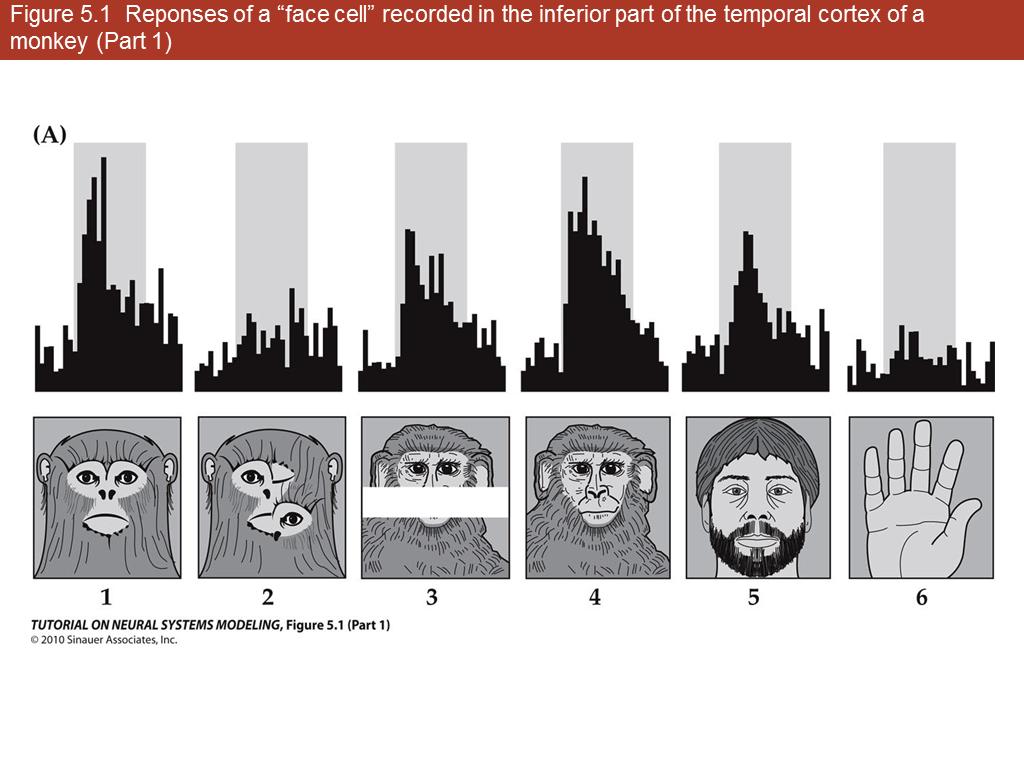 1. Figure 5.1 Reponses of a "face…
0
00:00/00:00
1. Figure 5.1 Reponses of a "face…
0
00:00/00:00 -
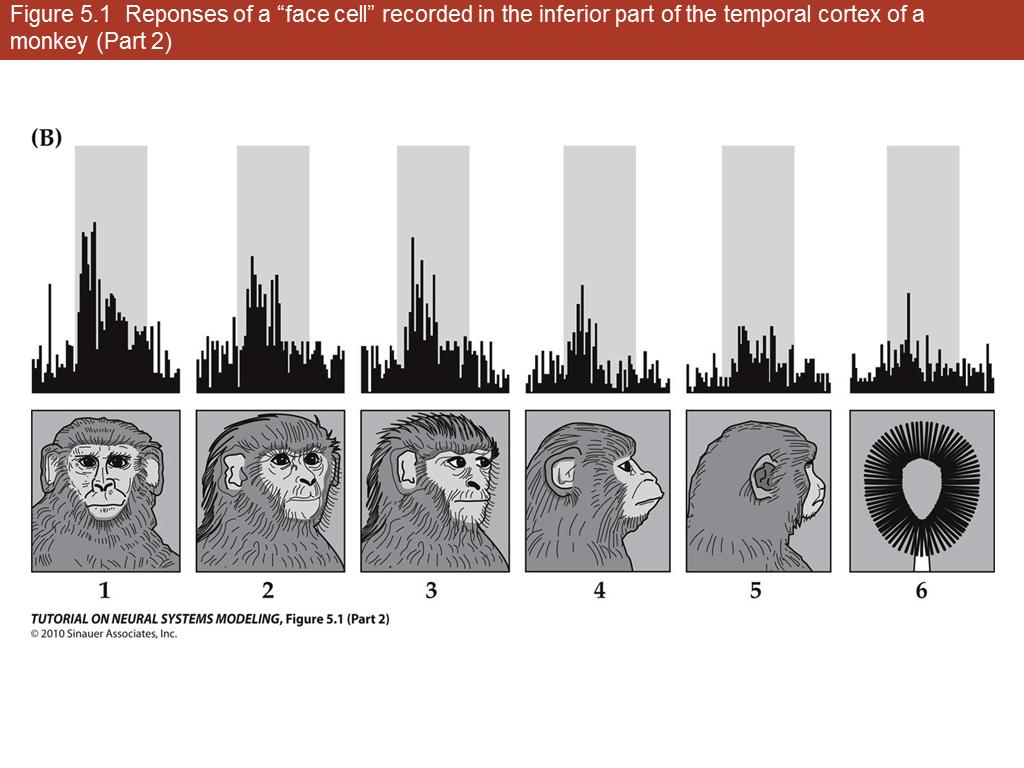 2. Figure 5.1 Reponses of a "face…
416.77615927419356
00:00/00:00
2. Figure 5.1 Reponses of a "face…
416.77615927419356
00:00/00:00 -
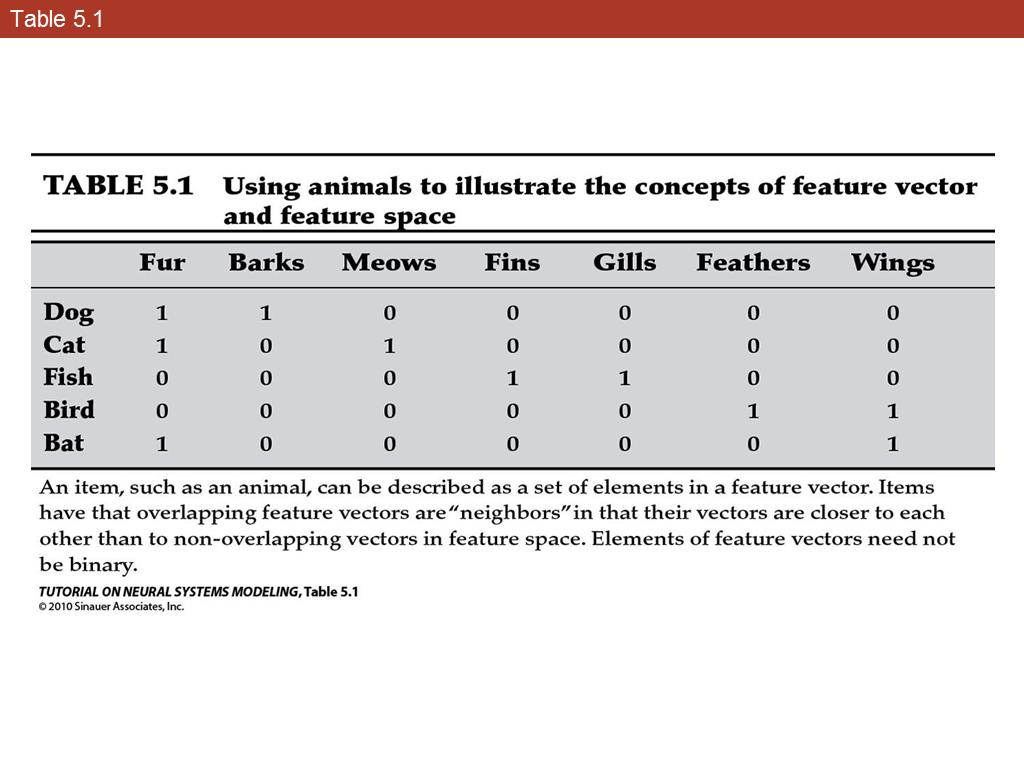 3. Table 5.1
527.8503528225807
00:00/00:00
3. Table 5.1
527.8503528225807
00:00/00:00 -
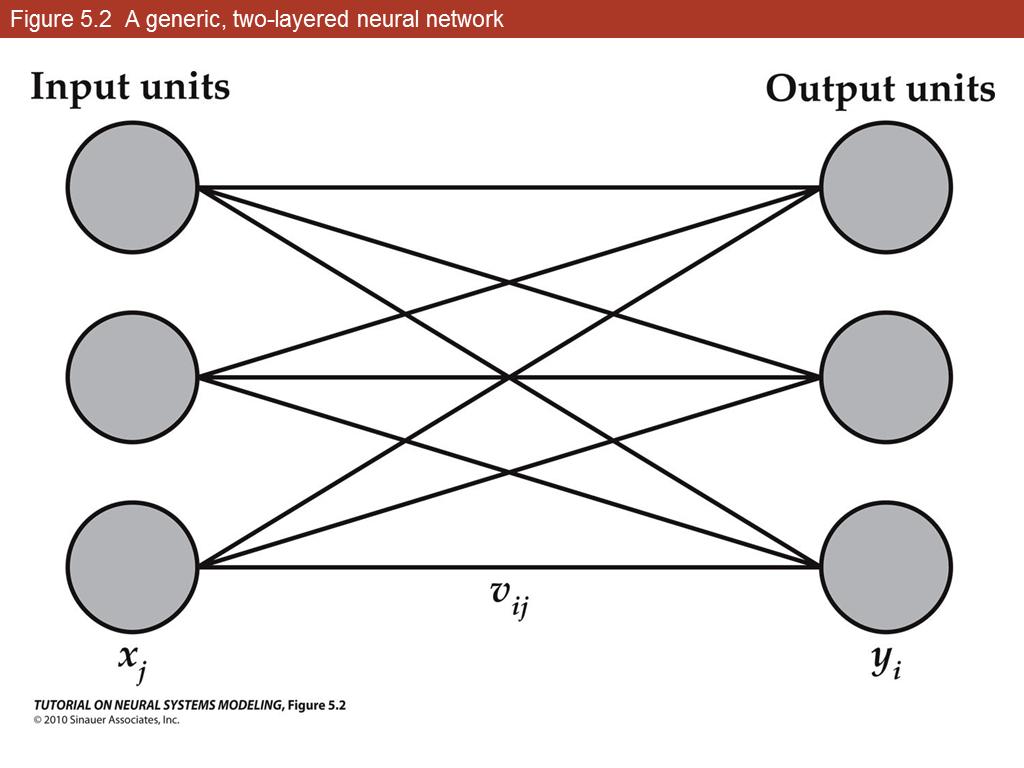 4. Figure 5.2 A generic, two-laye…
580.66018145161286
00:00/00:00
4. Figure 5.2 A generic, two-laye…
580.66018145161286
00:00/00:00 -
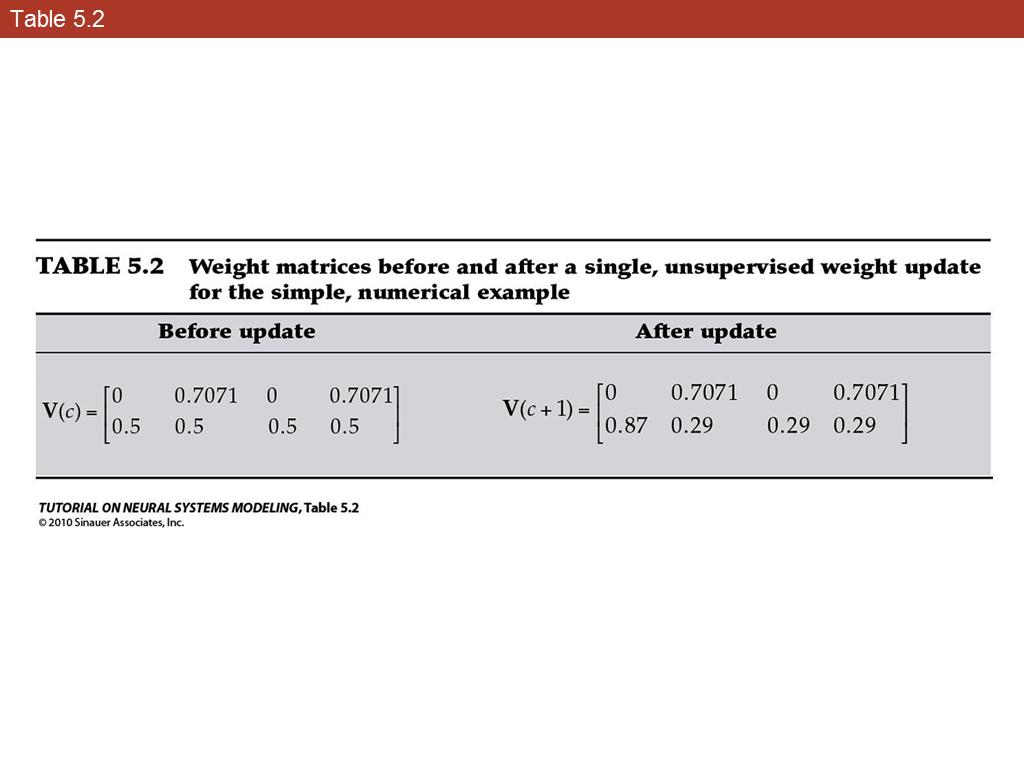 5. Table 5.2
1223.5516633064517
00:00/00:00
5. Table 5.2
1223.5516633064517
00:00/00:00 -
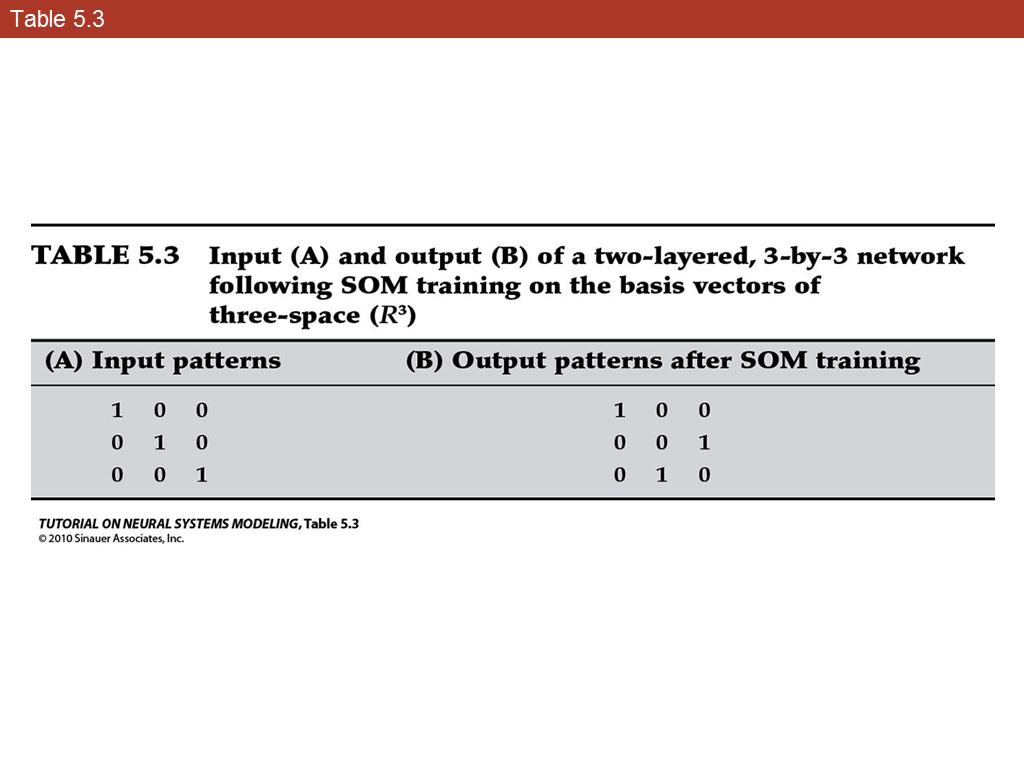 6. Table 5.3
1432.0637096774194
00:00/00:00
6. Table 5.3
1432.0637096774194
00:00/00:00 -
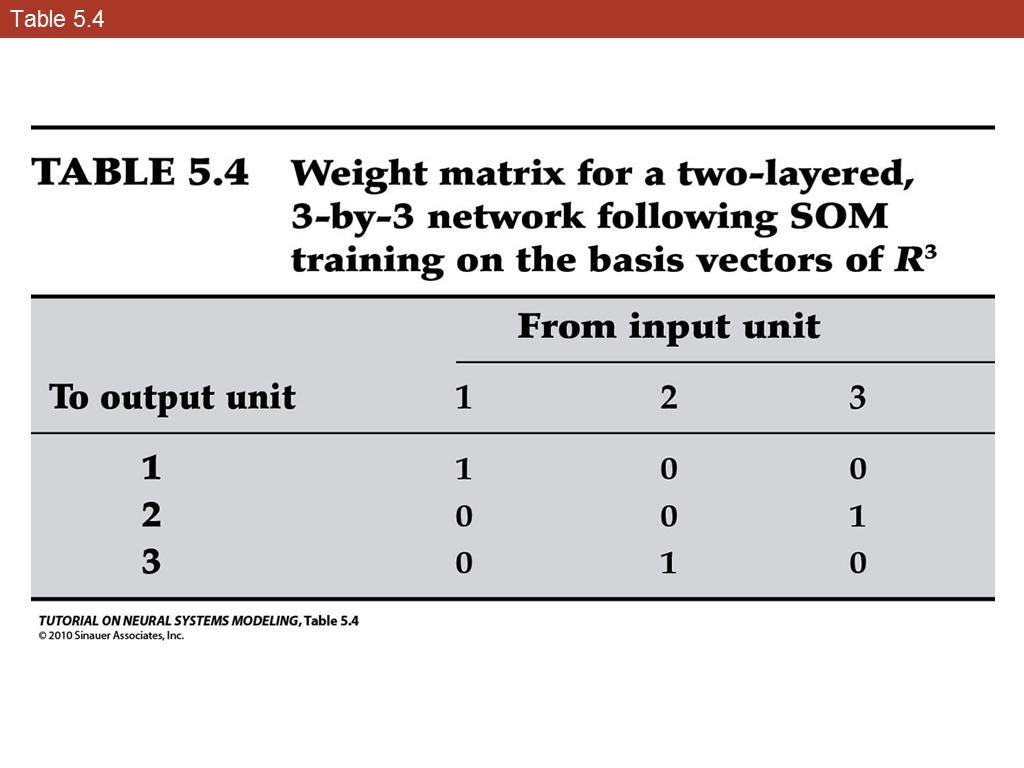 7. Table 5.4
1741.7326108870966
00:00/00:00
7. Table 5.4
1741.7326108870966
00:00/00:00 -
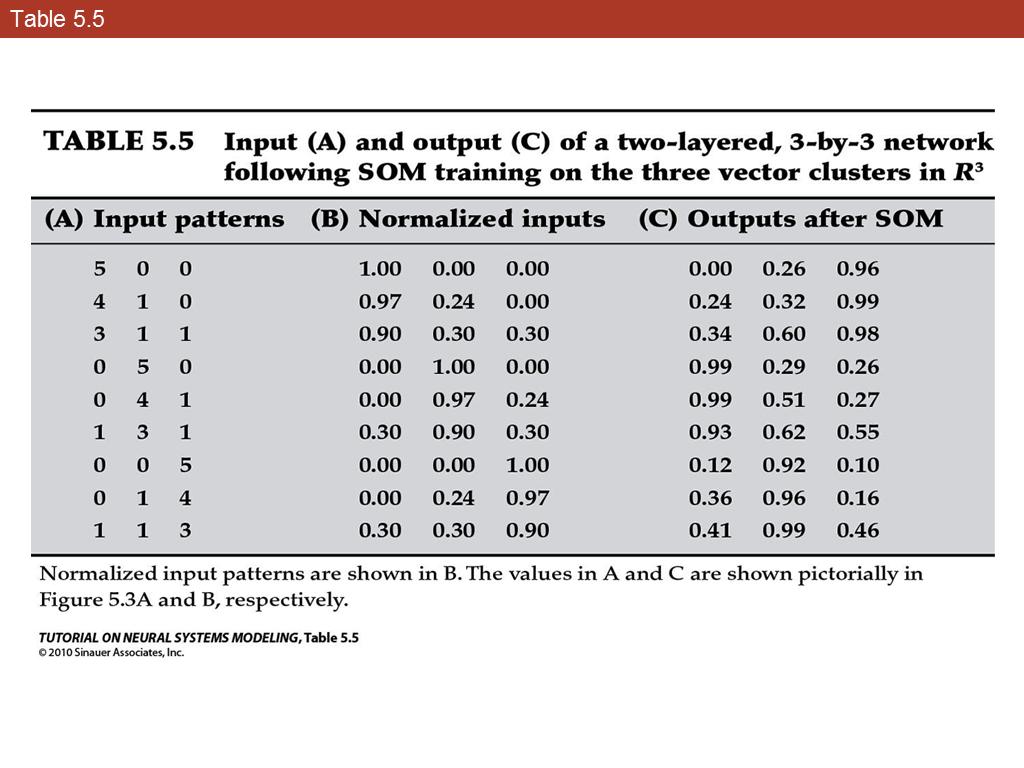 8. Table 5.5
1901.1538306451612
00:00/00:00
8. Table 5.5
1901.1538306451612
00:00/00:00 -
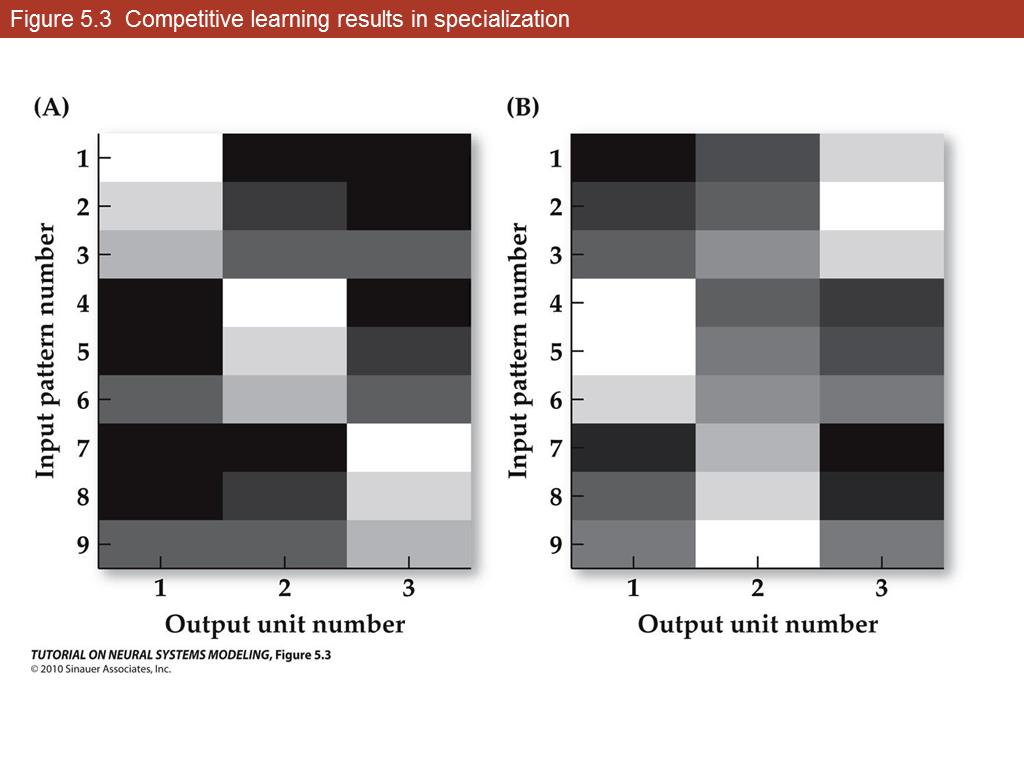 9. Figure 5.3 Competitive learnin…
2029.335433467742
00:00/00:00
9. Figure 5.3 Competitive learnin…
2029.335433467742
00:00/00:00 -
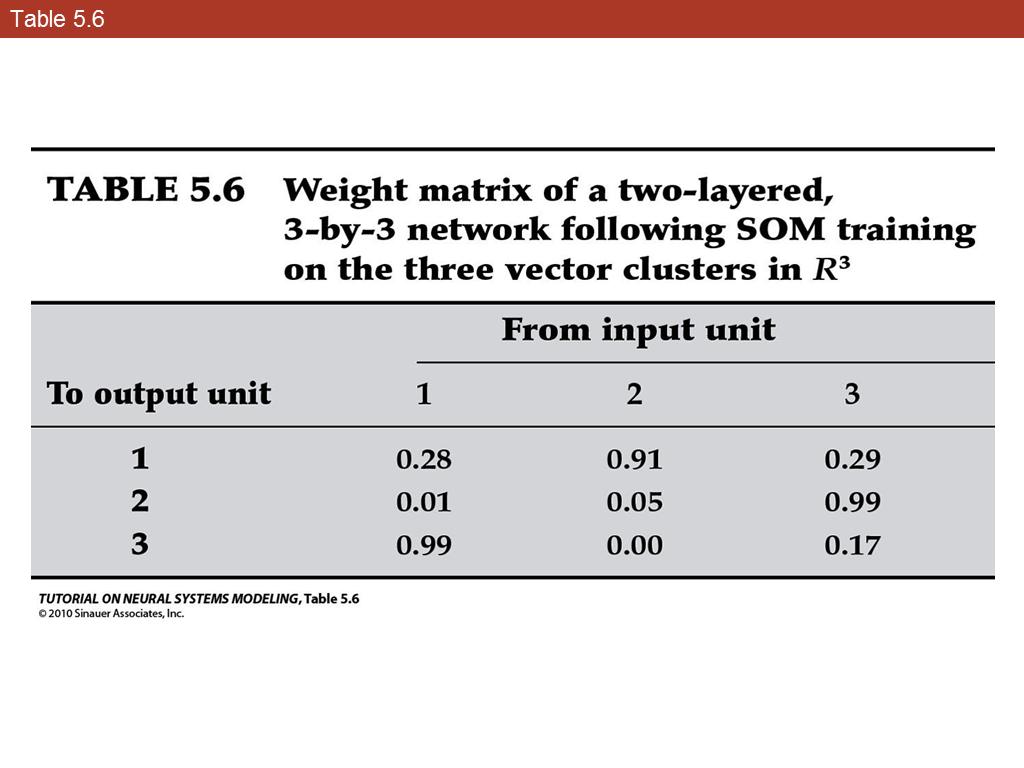 10. Table 5.6
2131.7319556451612
00:00/00:00
10. Table 5.6
2131.7319556451612
00:00/00:00 -
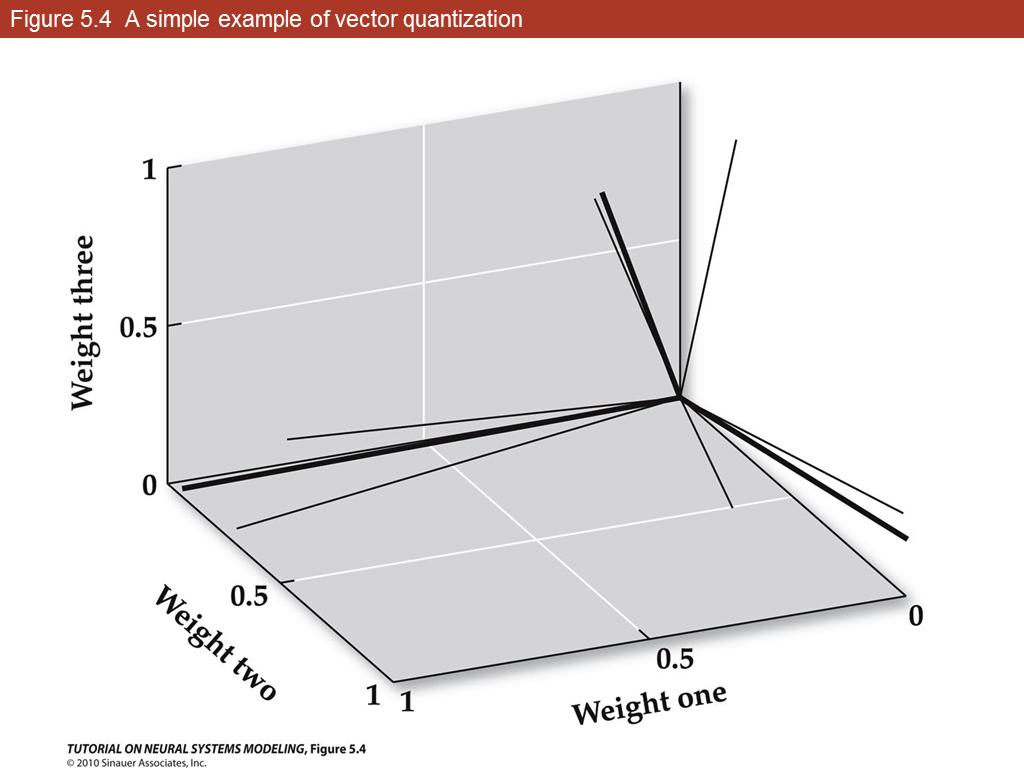 11. Figure 5.4 A simple example of…
2133.0955897177419
00:00/00:00
11. Figure 5.4 A simple example of…
2133.0955897177419
00:00/00:00 -
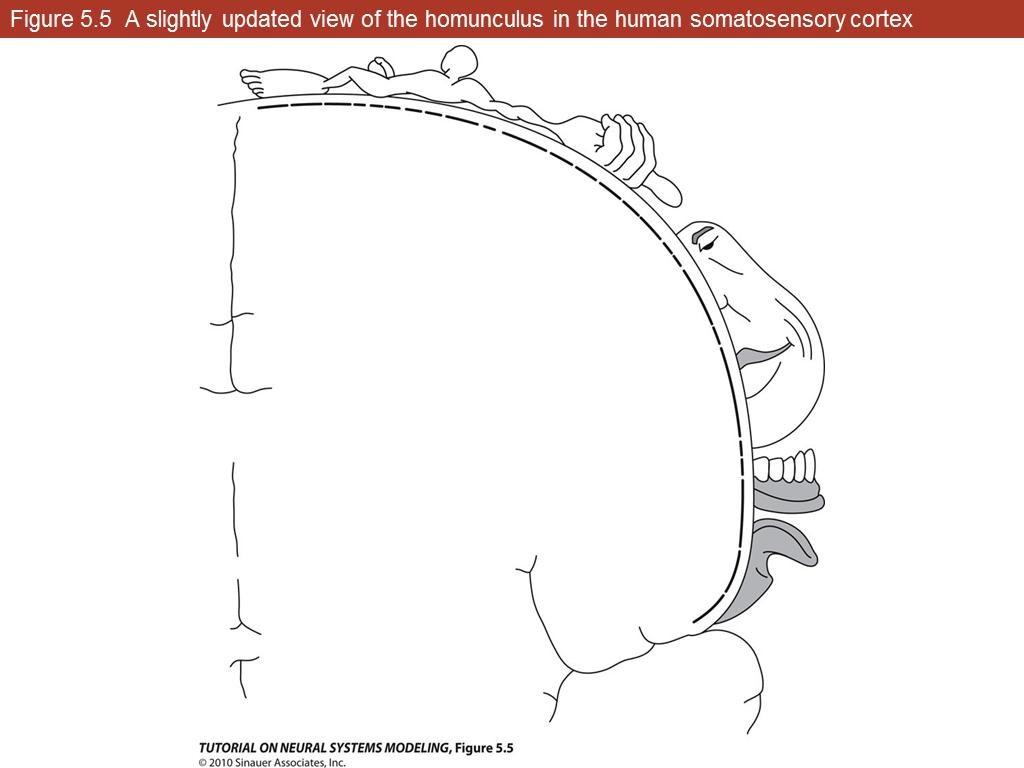 12. Figure 5.5 A slightly updated …
2263.260660282258
00:00/00:00
12. Figure 5.5 A slightly updated …
2263.260660282258
00:00/00:00 -
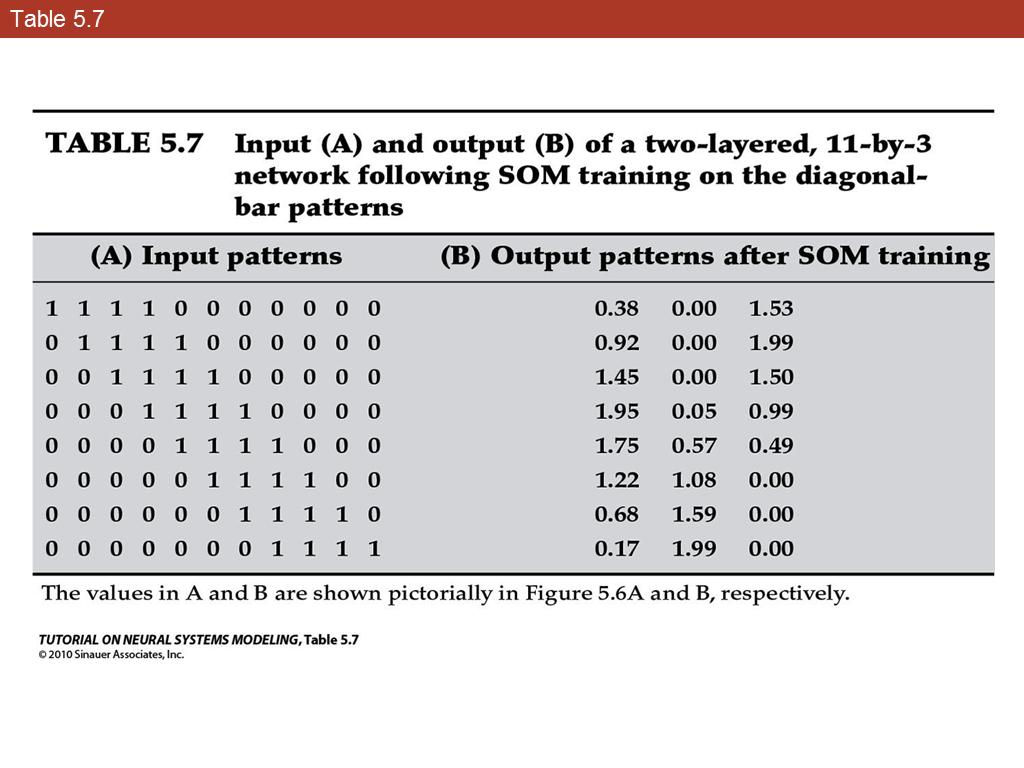 13. Table 5.7
2563.012222782258
00:00/00:00
13. Table 5.7
2563.012222782258
00:00/00:00 -
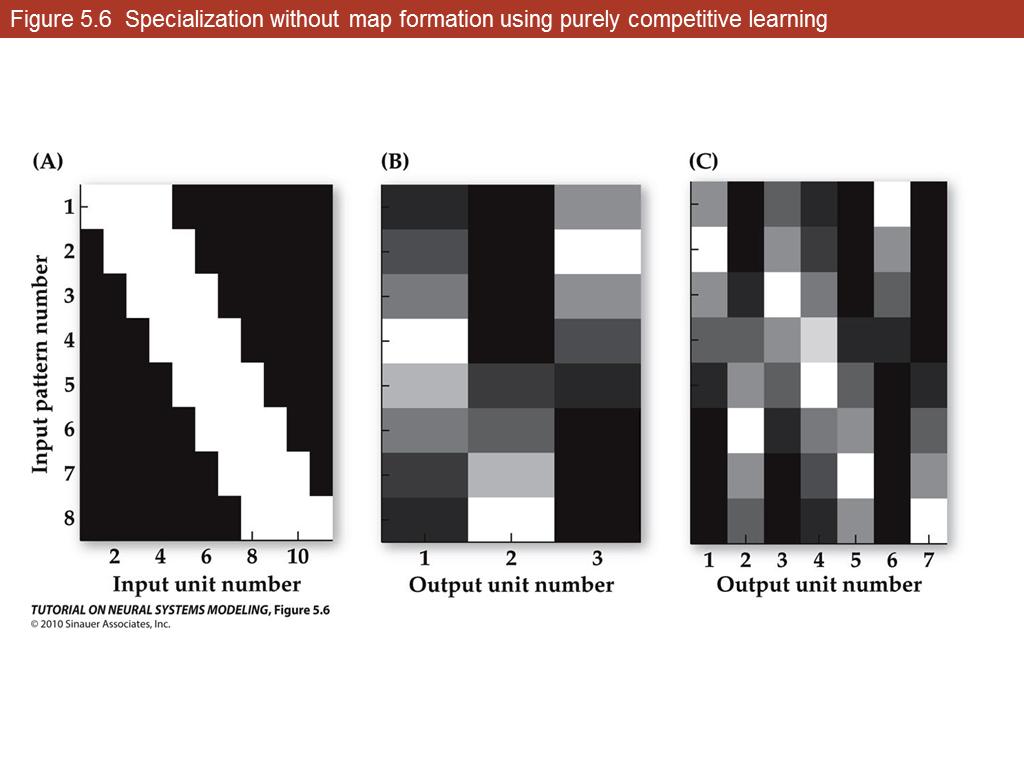 14. Figure 5.6 Specialization with…
2729.2516129032256
00:00/00:00
14. Figure 5.6 Specialization with…
2729.2516129032256
00:00/00:00 -
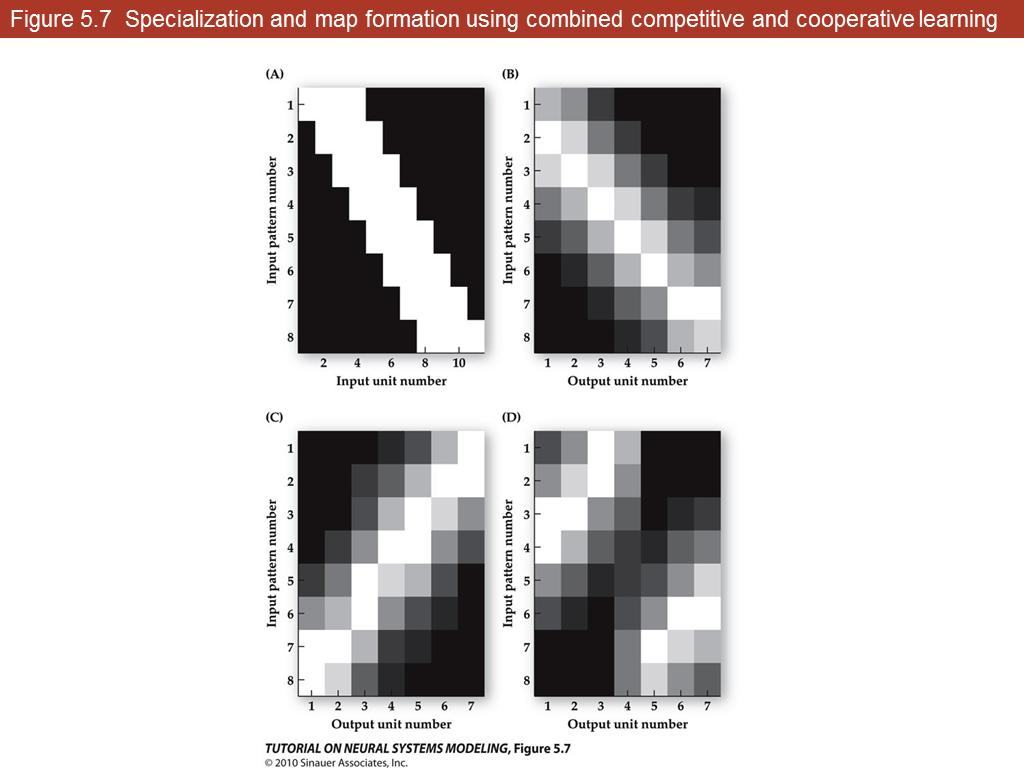 15. Figure 5.7 Specialization and …
2784.1688760080647
00:00/00:00
15. Figure 5.7 Specialization and …
2784.1688760080647
00:00/00:00 -
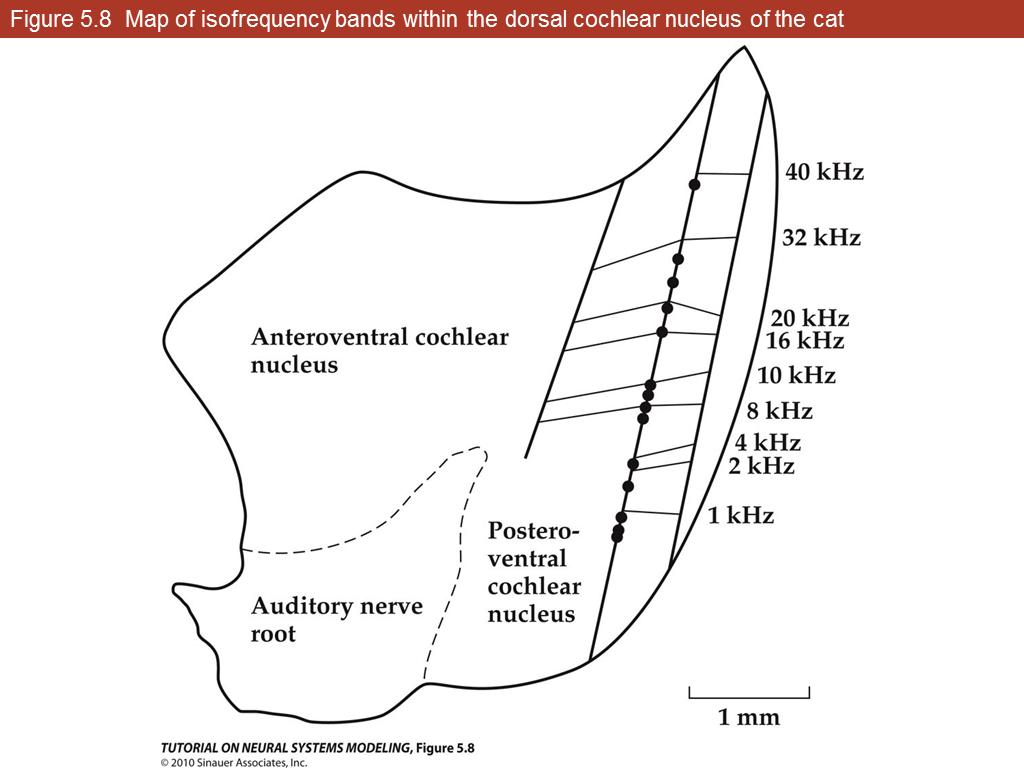 16. Figure 5.8 Map of isofrequency…
3000.7387600806451
00:00/00:00
16. Figure 5.8 Map of isofrequency…
3000.7387600806451
00:00/00:00 -
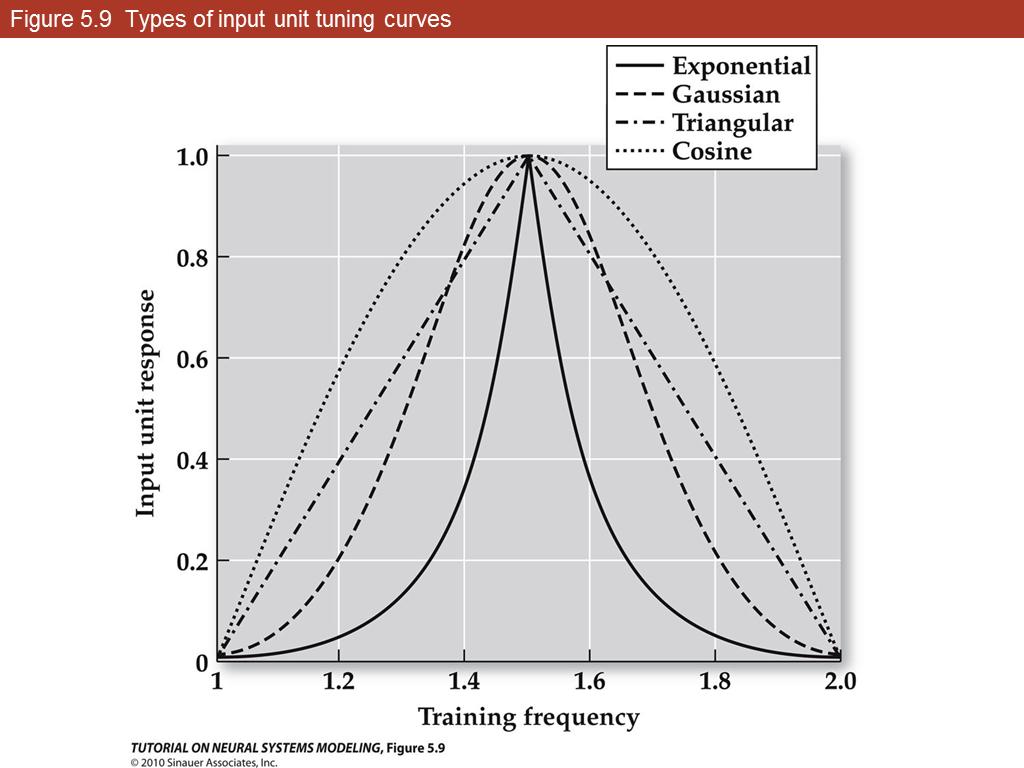 17. Figure 5.9 Types of input unit…
3099.9121471774197
00:00/00:00
17. Figure 5.9 Types of input unit…
3099.9121471774197
00:00/00:00 -
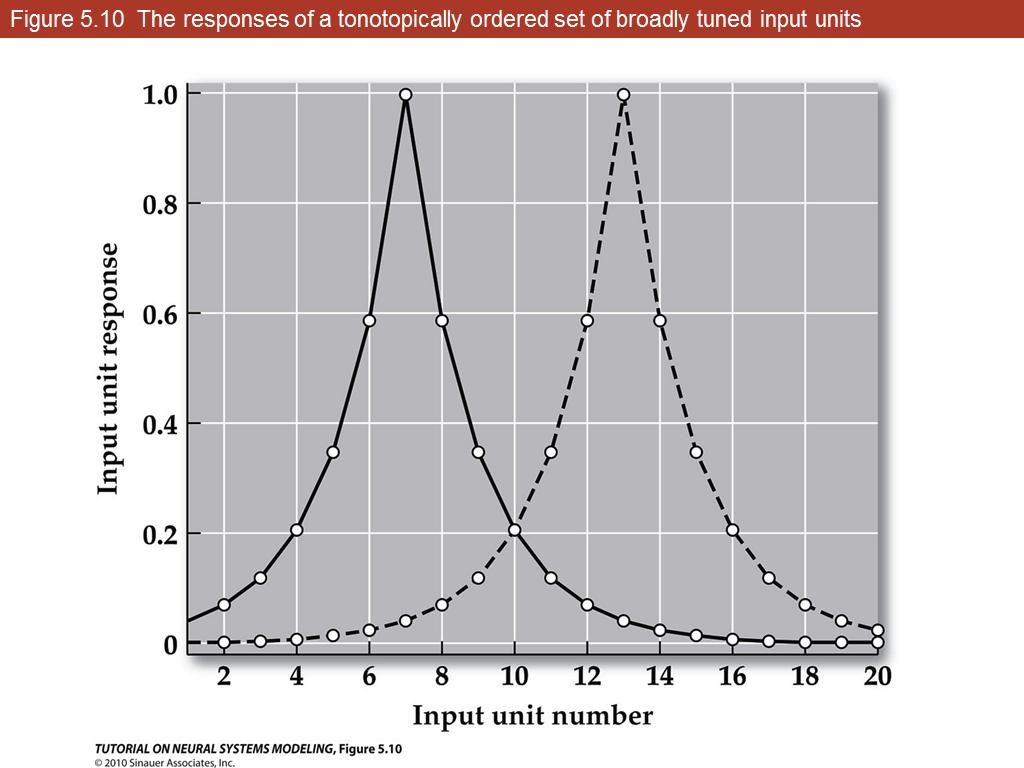 18. Figure 5.10 The responses of a…
3189.2921622983868
00:00/00:00
18. Figure 5.10 The responses of a…
3189.2921622983868
00:00/00:00 -
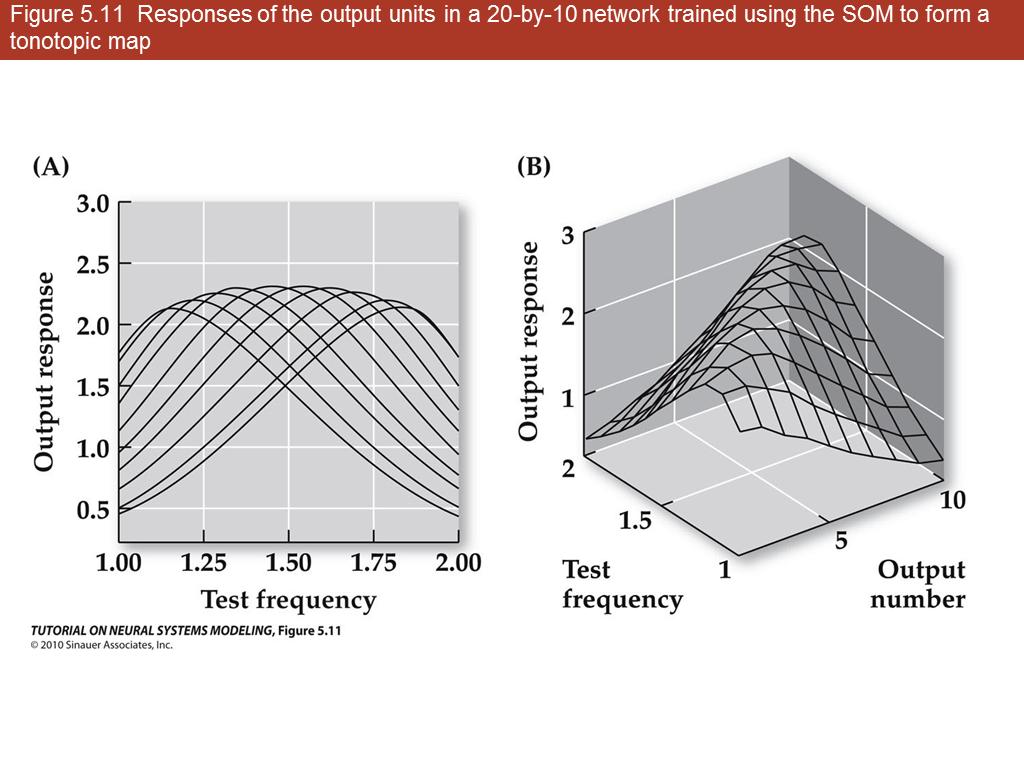 19. Figure 5.11 Responses of the o…
3435.4900957661289
00:00/00:00
19. Figure 5.11 Responses of the o…
3435.4900957661289
00:00/00:00 -
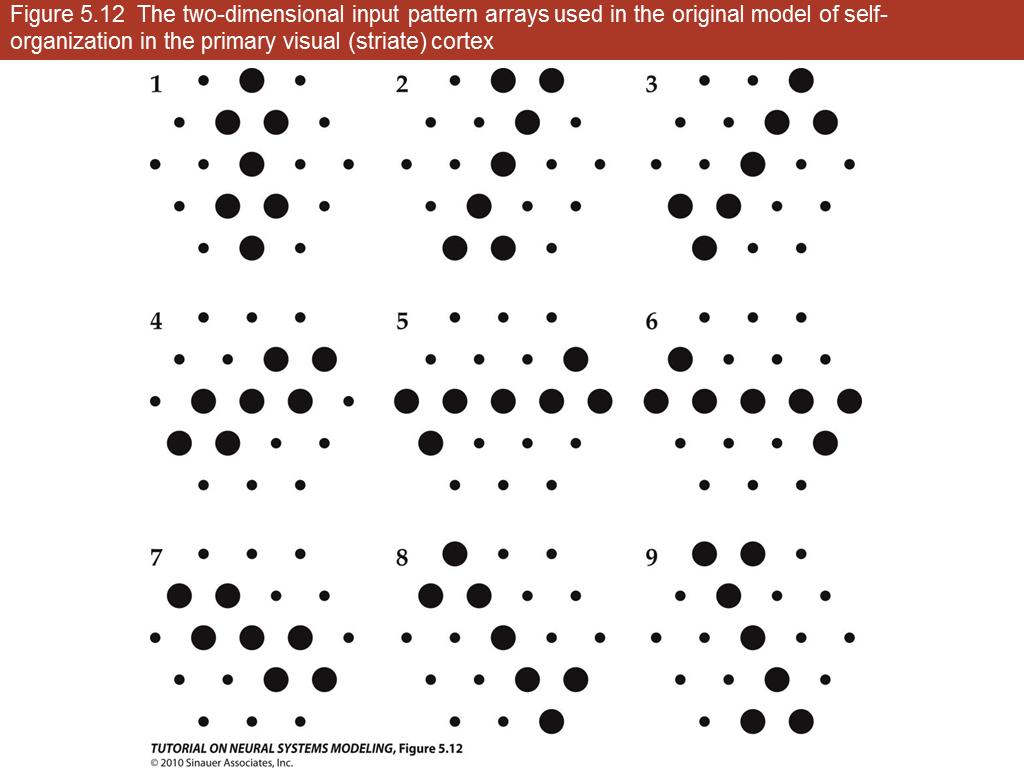 20. Figure 5.12 The two-dimensiona…
3760.1589717741936
00:00/00:00
20. Figure 5.12 The two-dimensiona…
3760.1589717741936
00:00/00:00 -
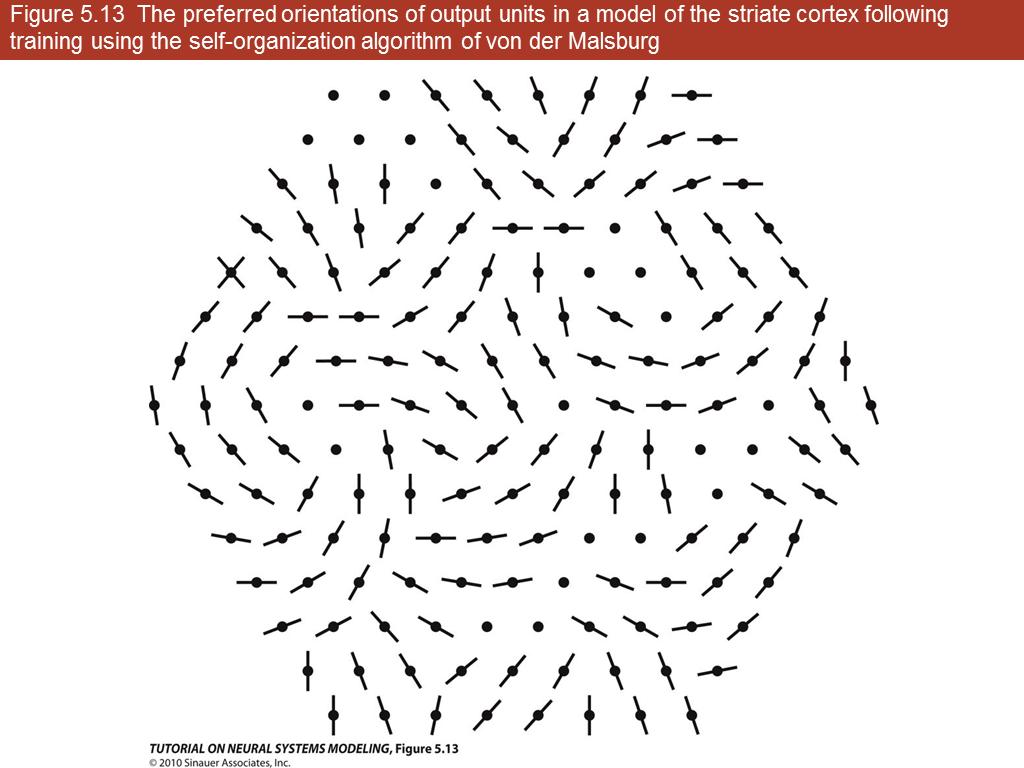 21. Figure 5.13 The preferred orie…
3822.8861391129035
00:00/00:00
21. Figure 5.13 The preferred orie…
3822.8861391129035
00:00/00:00 -
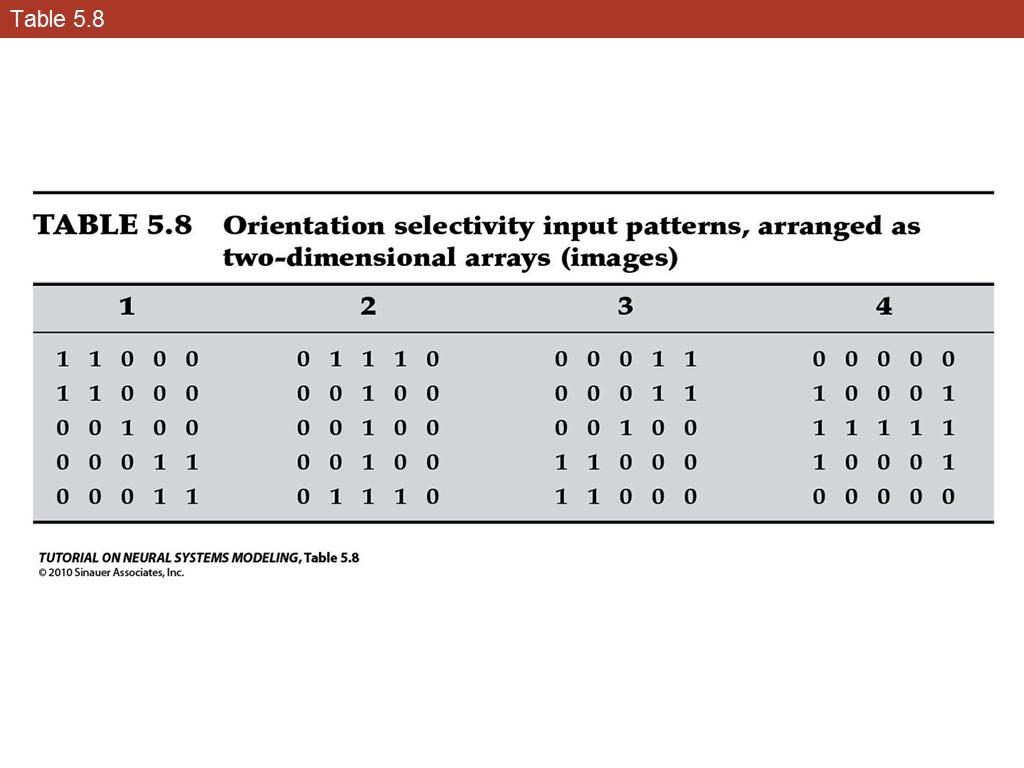 22. Table 5.8
4062.01796875
00:00/00:00
22. Table 5.8
4062.01796875
00:00/00:00 -
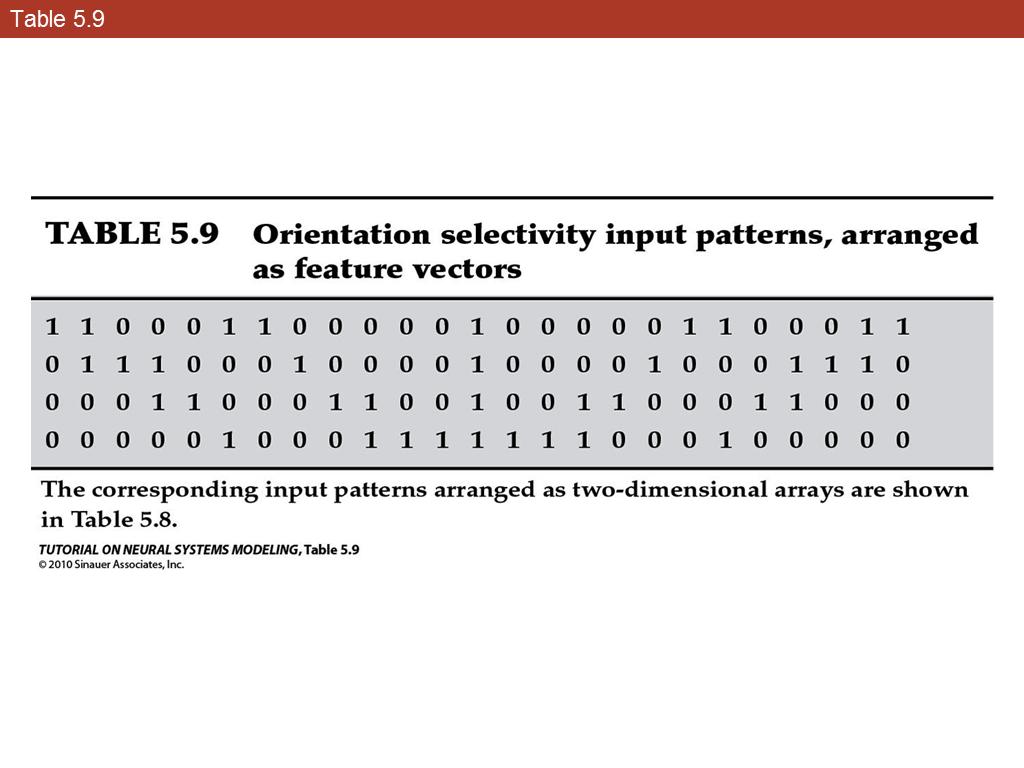 23. Table 5.9
4062.01796875
00:00/00:00
23. Table 5.9
4062.01796875
00:00/00:00 -
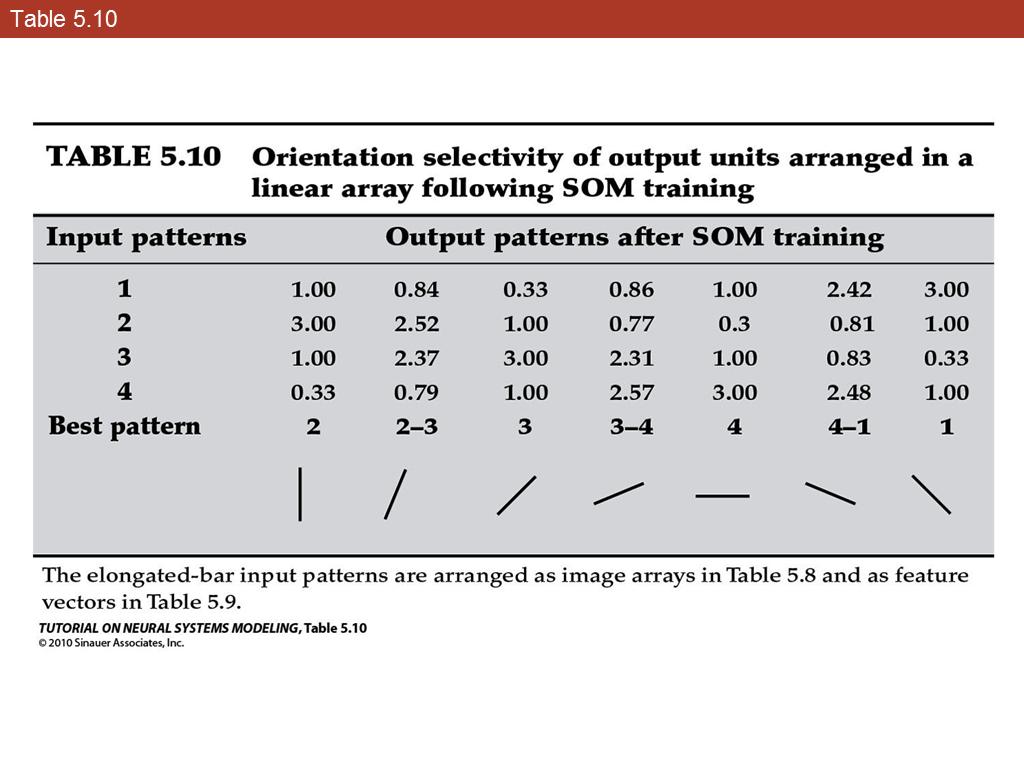 24. Table 5.10
4062.01796875
00:00/00:00
24. Table 5.10
4062.01796875
00:00/00:00 -
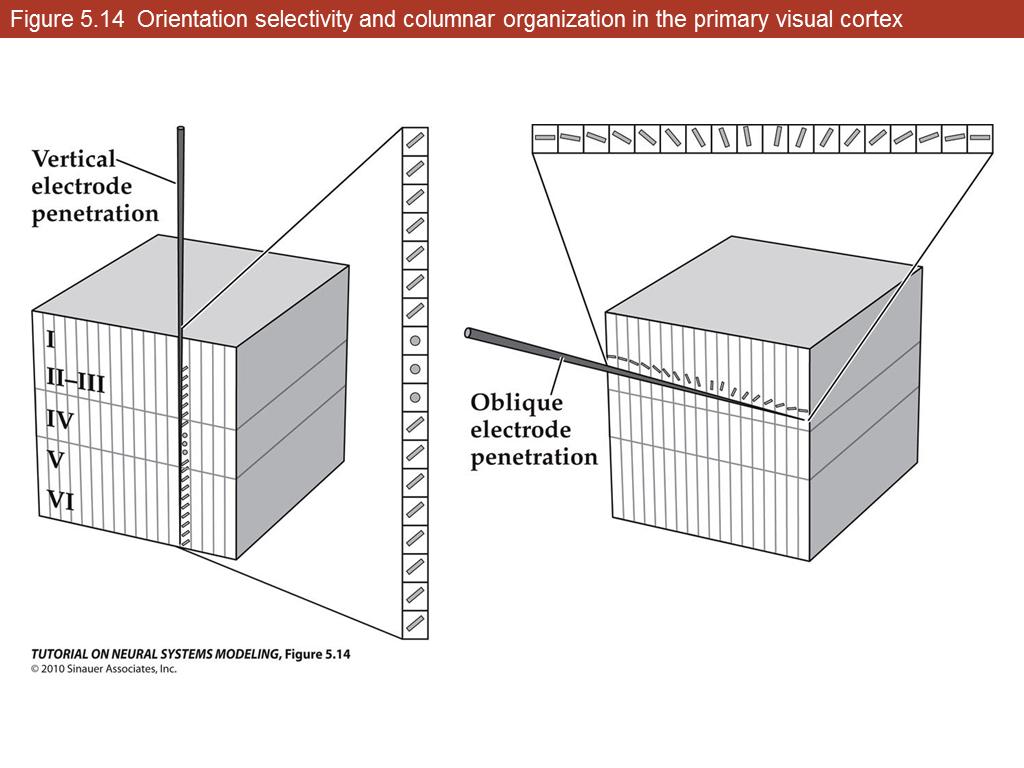 25. Figure 5.14 Orientation select…
4062.01796875
00:00/00:00
25. Figure 5.14 Orientation select…
4062.01796875
00:00/00:00 -
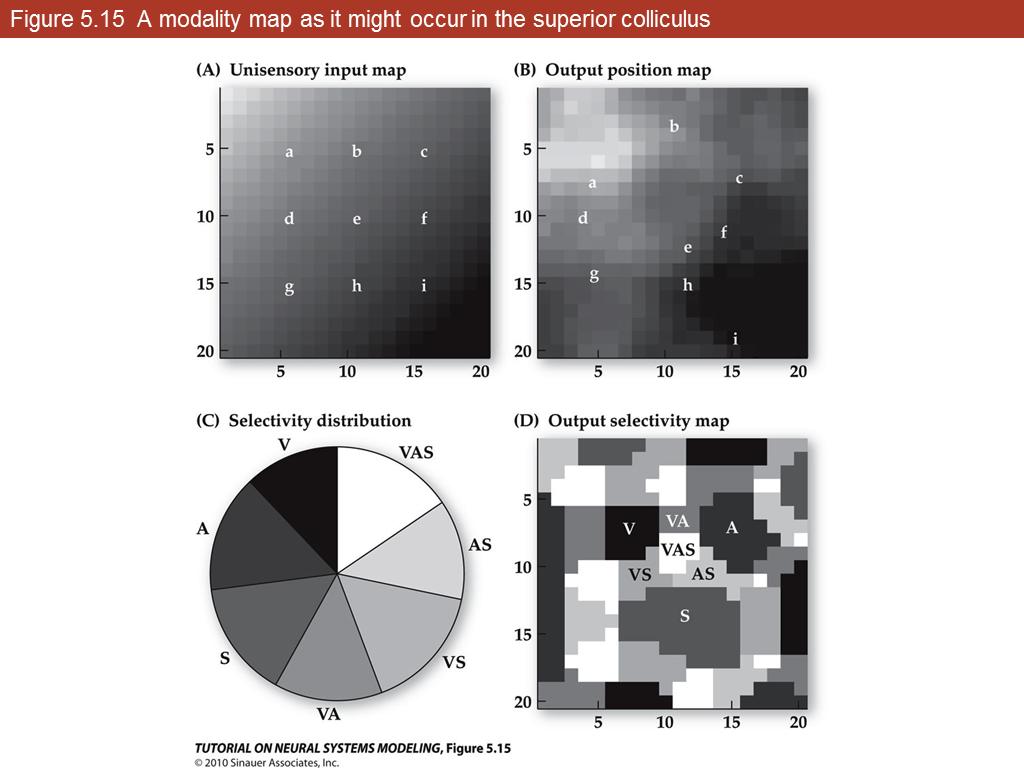 26. Figure 5.15 A modality map as …
4062.01796875
00:00/00:00
26. Figure 5.15 A modality map as …
4062.01796875
00:00/00:00