You must login before you can run this tool.


Category
Published on
Abstract
What is Solar PV?
A residential solar photovoltaic (PV) system is composed of an array of solar photovoltaic panels, an inverter, a racking system, and an optional energy storage device. Several factors affect the design of the solar PV system, including weather, component costs, electricity usage patterns of appliances, and grid electricity costs.
The purpose of this tool is to help users understand the effects of all these factors when designing a distributed solar PV system. Users select profiles for the appliances, temperature, cloud cover, and solar irradiation for the region they would like to model. Next users describe the solar PV systems available in the region, noting the percentage of households that have a solar PV system, determining solar panel capacity and whether the system includes a battery. After running the model, users can view the projected hourly average electric demand and the total daily electric demand over a one month period.
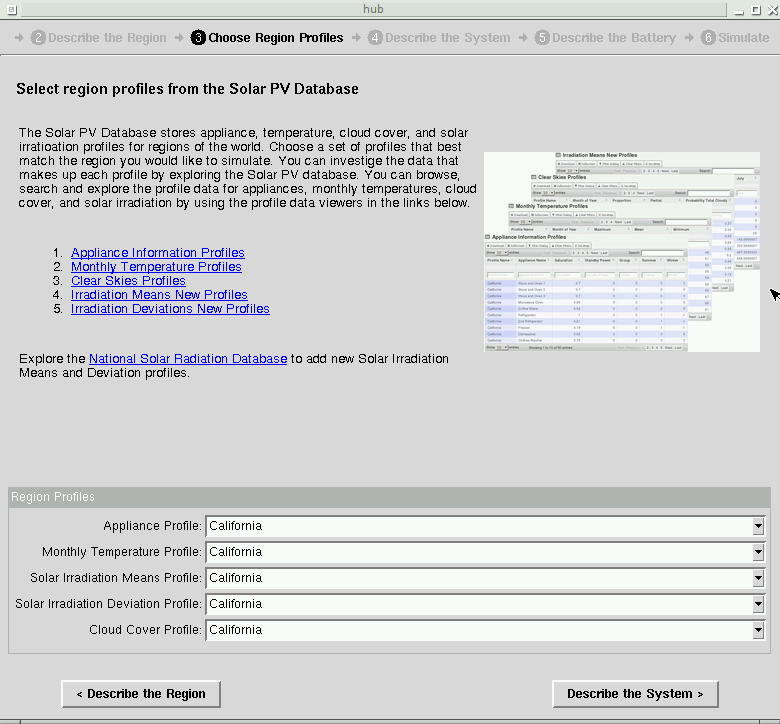
What's in the Solar PV Database?
The Solar PV Database stores profiles that users will select from when running Solar PV simulations, Profile "data viewers" are provided in this section, so that users can browse, search and explore the profile data for appliances, monthly temperatures, cloud cover, and solar irradiation. The profile data viewers help uses become familiar with the profiles before they have to make profile selections to run the Solar PV simulations.
Use the Profile Data Viewer below to browse, search, explore and download profile data from the Solar PV database.
reload the Profile Viewer list
Can I add my own profiles to the Solar PV Database?
Yes, users can create their own profiles and contribute them to the Solar PV Database. These new profiles will then be available for simulation with the Solar PV tool.
This section helps users create their own profiles for appliances, temperatures and clear skies. Users can also retrieve irradiation data from the National Solar Radiation Database and use it to create new profiles for irradiation mean and standard deviation, Spreadsheet templates are provided for each of the five profiles: appliance information, monthly temperatures, clear skies, irradiation mean and irradiation standard deviation. Users download a spreadsheet template, fill in values, and then upload the completed spreadsheet profile for curation. Approved profiles are loaded into the Solar PV database, where they can be selected for Solar PV simulations. Here is a description of the profile contribution process.
| Task | Description | Notes and Suggestions |
| Download the profile template | To contribute a new profile, select the template to download |
Save the spreadsheet template to your desktop.The template is in CSV file format. |
| Enter data into the profile template | Fill in the profile template with your own profile data. Use the Profile Viewer to see the data for existing Solar PV profiles, so you understand what types of data are expected for your profile. For Appliance, Temperature and Clear Skies Profiles: First, enter the name of your profile in column 1 for every row. Your profile name should be as follows:state-abbreviation-yourlastname, for example, IN-Jones. Some columns will already be filled with data, listing appliances or months. Fill in values for all other columns and rows. For Irradiation Profiles: Read this document for instructions. |
After completing your data entry, save your completed spreadsheet to your desktop in CSV format.. |
| Email your completed profile | After your spreadsheet profile data has been entered, checked, and saved in CSV file format, email your CSV file to Xiaohui Liu (liuxiaohui714@gmail.com) for review. Spreadsheets with errors will be returned for corrections. | Approved spreadsheets will be loaded into the SolarPV database, where they can be selected from the profile menus in the Solar PV tool. |
Exploring National Solar Radiation Data
Users can browse, explore, search, download and plot statistical summary data with the Solar PV National Solar Radiation Hourly Statistics Viewer.
|
Viewer for National Solar Radiation Hourly Statistics Here we show Lafayette Purdue University AP, January - December 2010 with Monthly Mean |
This Viewer displays irradiation data for class I and class II sites across all 50 states, and includes:
|
References
Huang, S. S.; Xiao, J. J.; Pekny, J. F.; Reklaitis, G. V.; Liu, A. L. Quantifying System-Level Benefits from Distributed Solar and Energy Storage. J Energ Eng-Asce 2012, 138, 33-42.
Cite this work
Researchers should cite this work as follows: