ECE 606 L13: Band Diagrams
ECE 606 L13: Band Diagrams
-
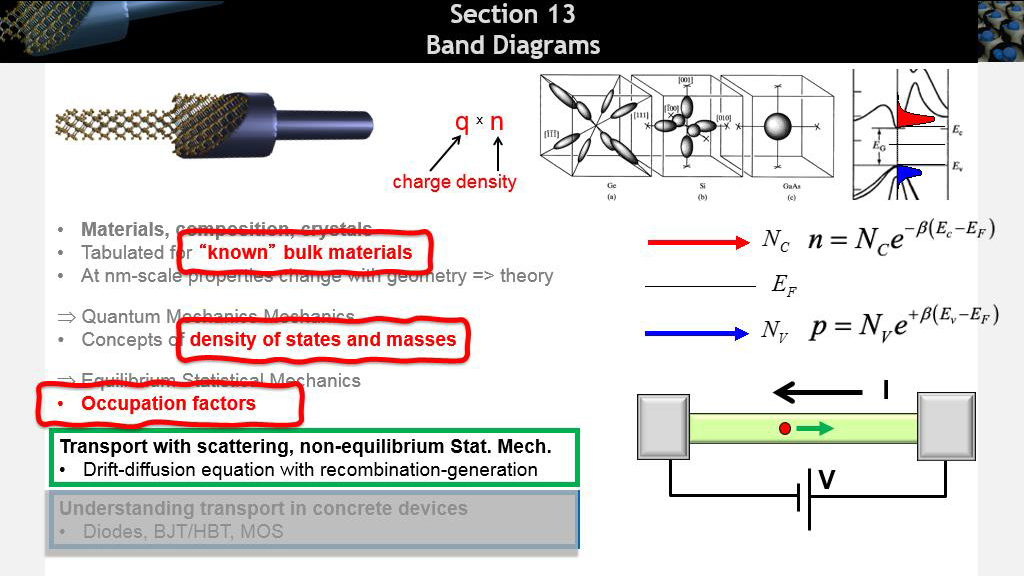
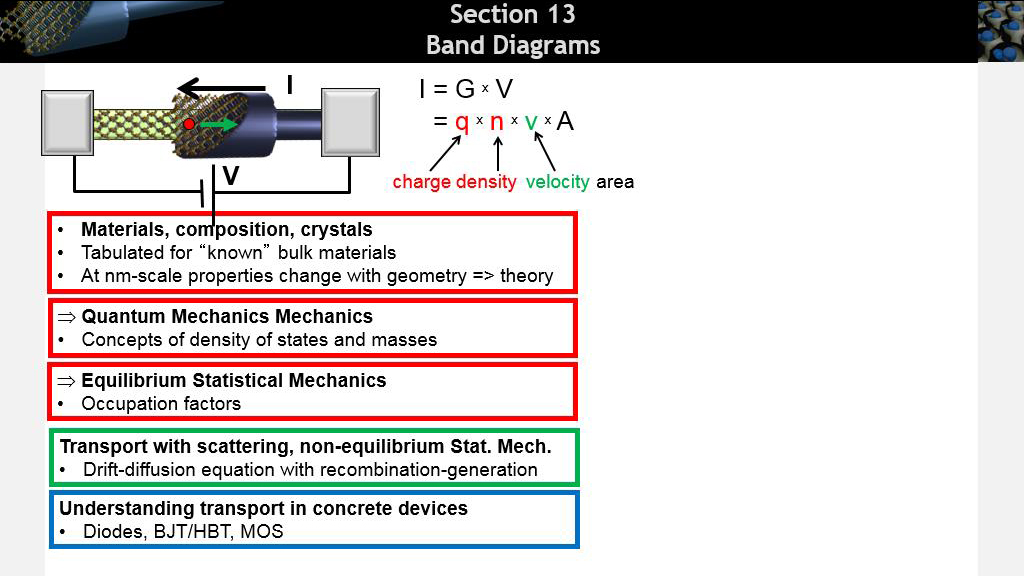
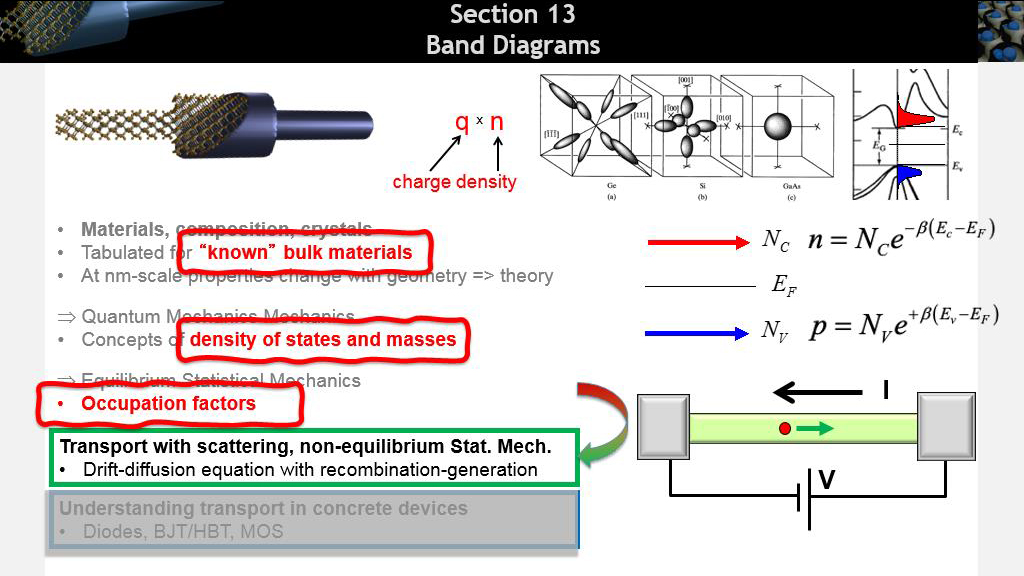
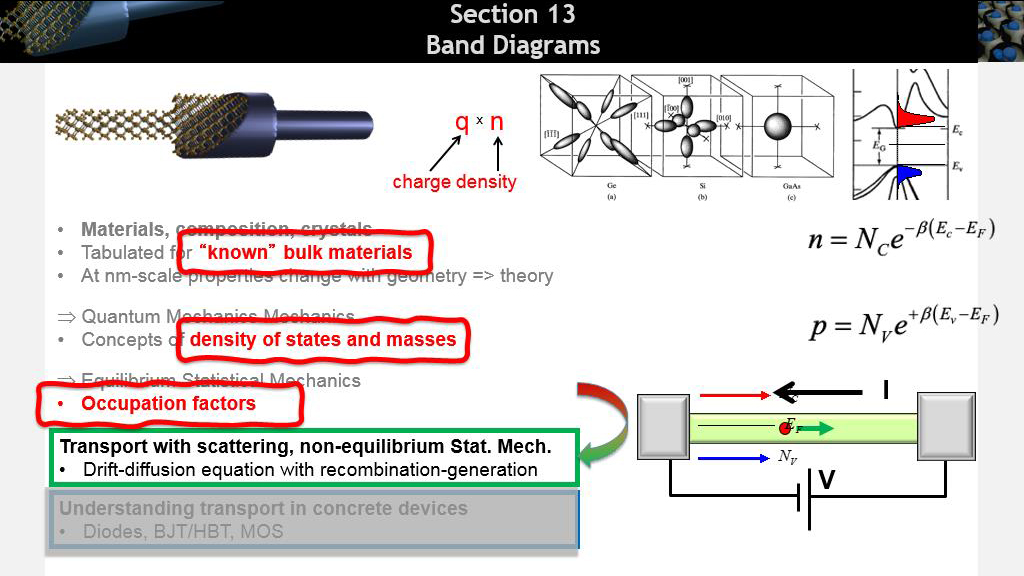
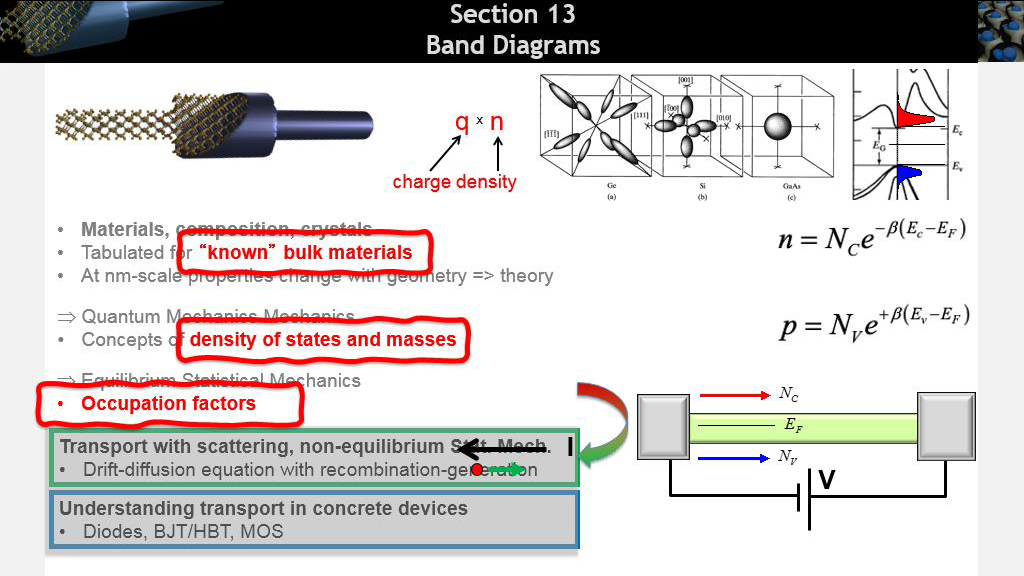
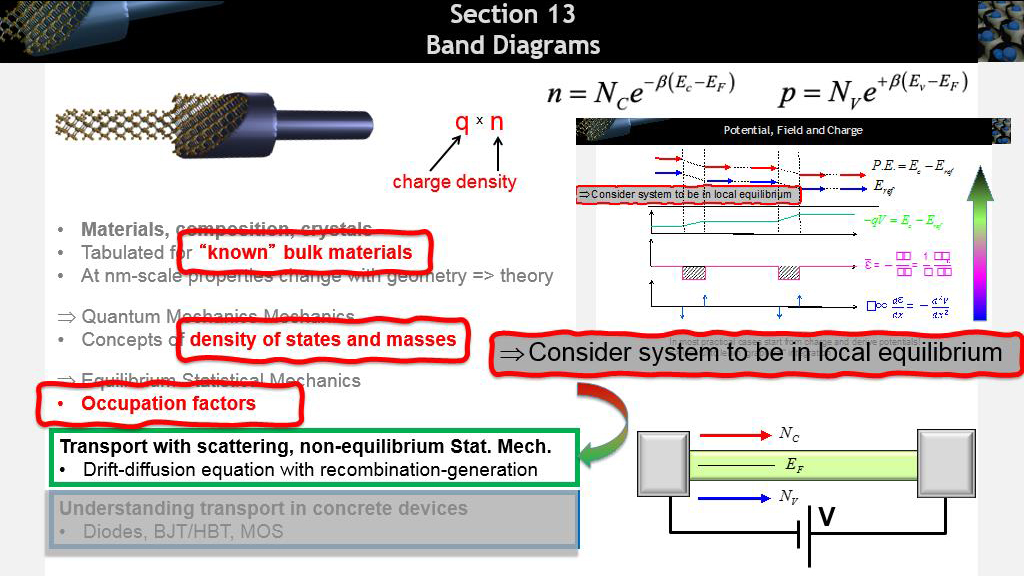
 1. Section 13 Band Diagrams
0
00:00/00:00
1. Section 13 Band Diagrams
0
00:00/00:00 -
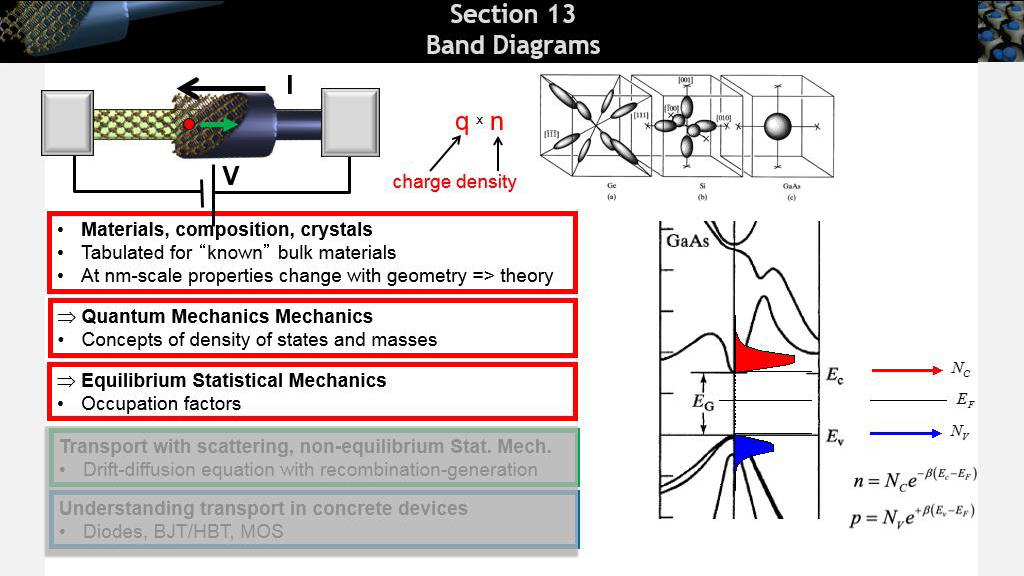
 2. Section 13 Band Diagrams
34.434434434434436
00:00/00:00
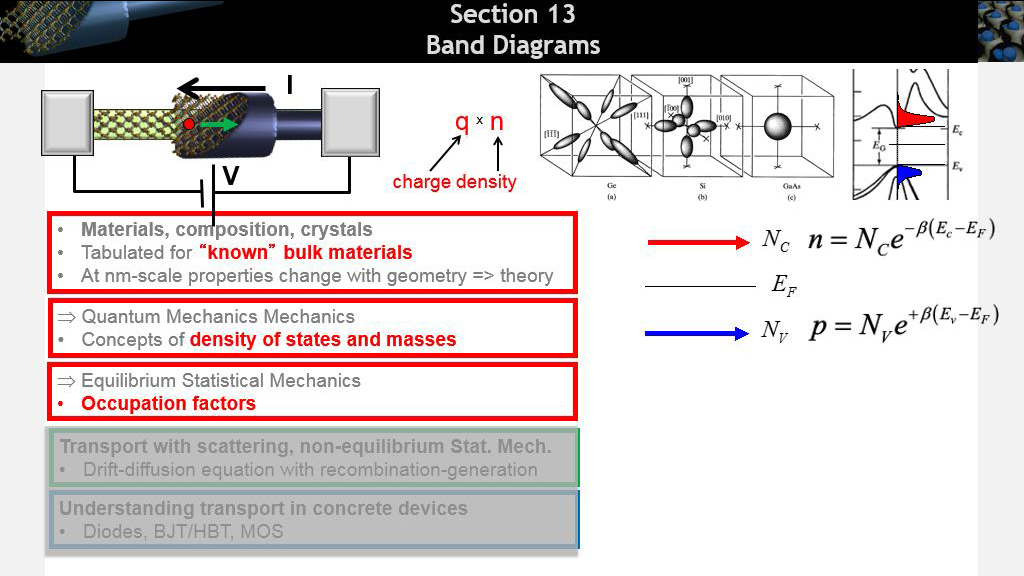
2. Section 13 Band Diagrams
34.434434434434436
00:00/00:00 -
 3. Section 13 Band Diagrams
48.948948948948953
00:00/00:00
3. Section 13 Band Diagrams
48.948948948948953
00:00/00:00 -
 4. Section 13 Band Diagrams
110.51051051051051
00:00/00:00
4. Section 13 Band Diagrams
110.51051051051051
00:00/00:00 -
 5. Section 13 Band Diagrams
133.29996663329996
00:00/00:00
5. Section 13 Band Diagrams
133.29996663329996
00:00/00:00 -
 6. Section 13 Band Diagrams
151.98531865198532
00:00/00:00
6. Section 13 Band Diagrams
151.98531865198532
00:00/00:00 -
 7. Section 13 Band Diagrams
164.49783116449782
00:00/00:00
7. Section 13 Band Diagrams
164.49783116449782
00:00/00:00 -
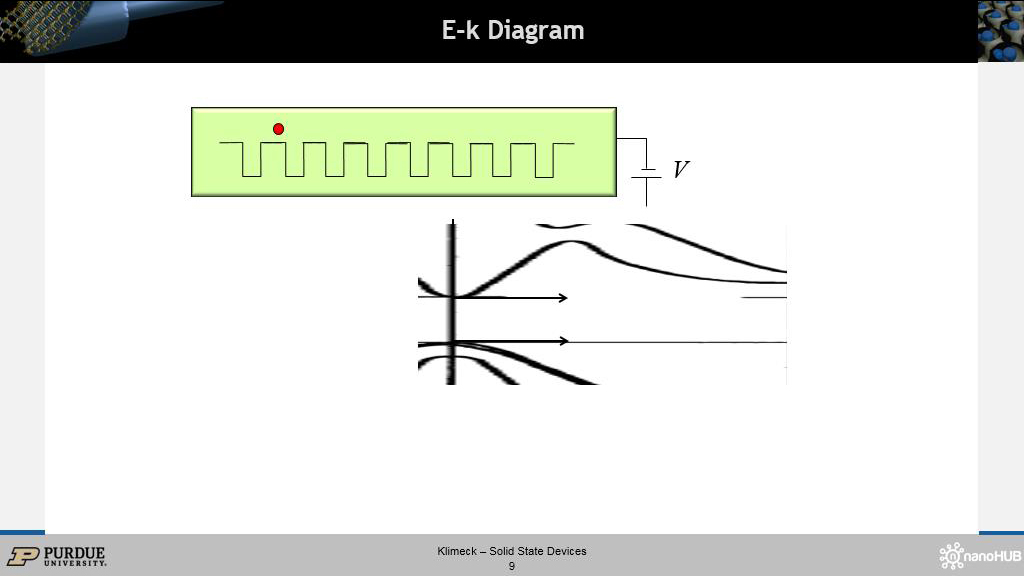
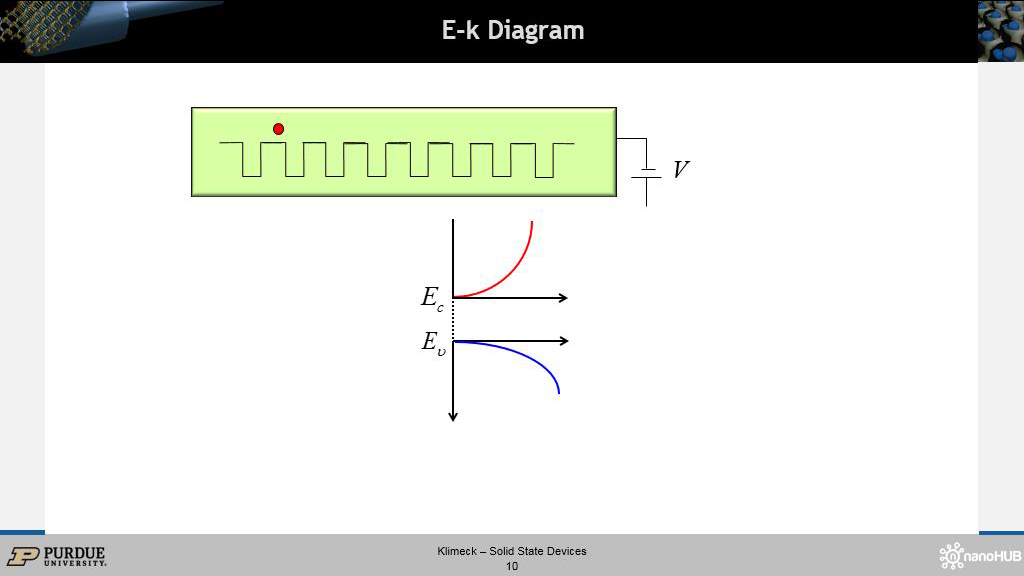
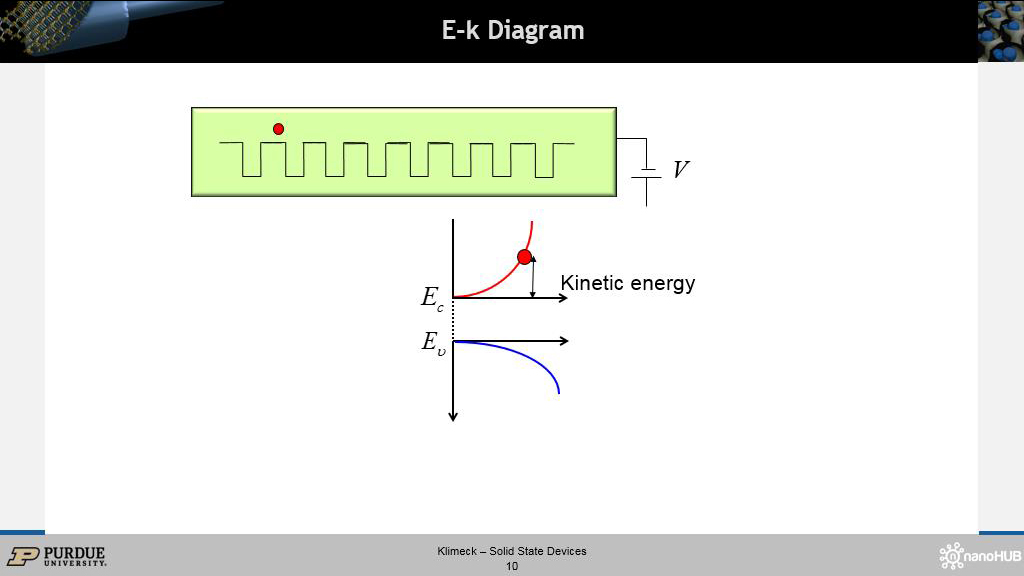
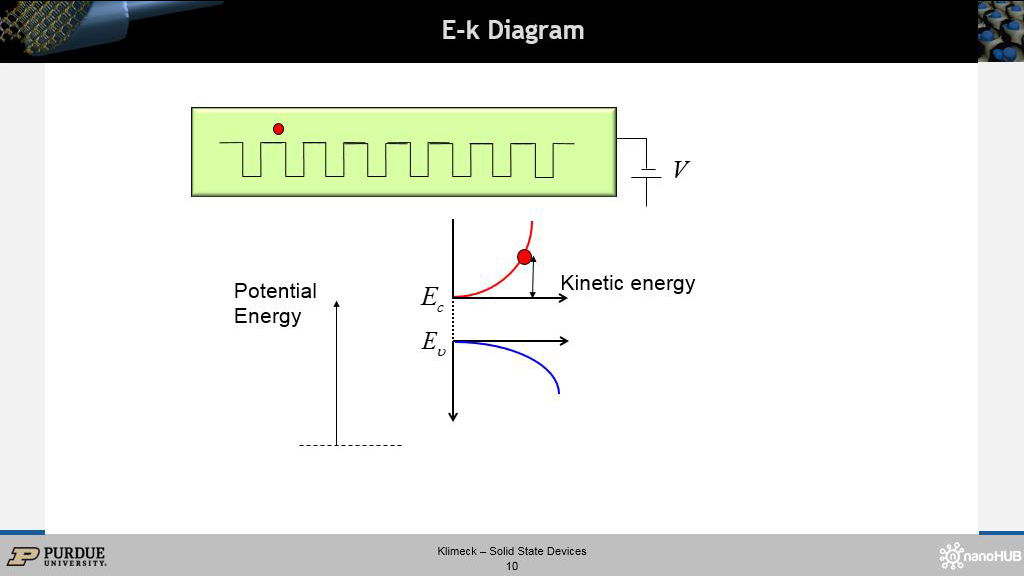
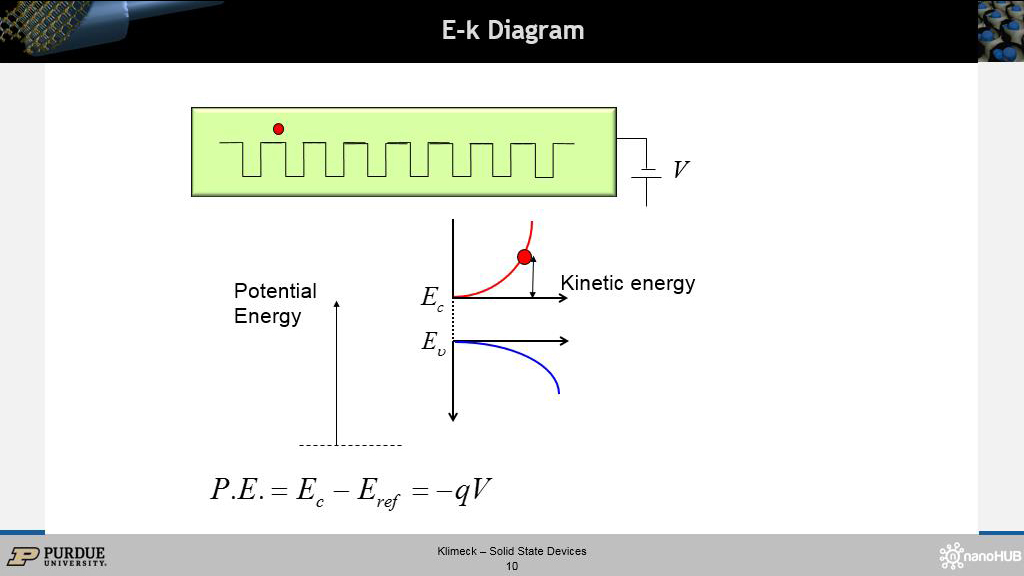
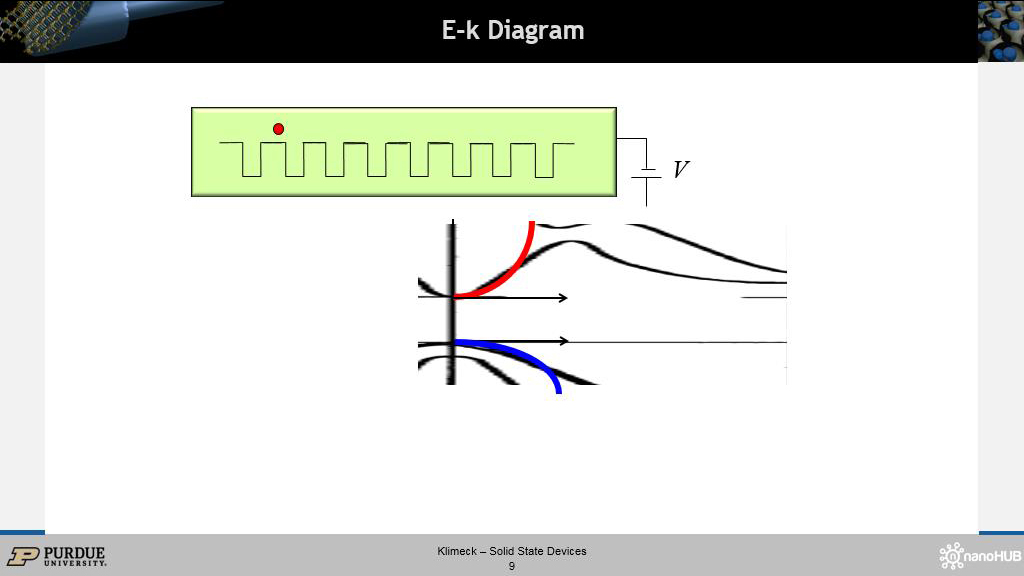 8. E-k Diagram
175.47547547547549
00:00/00:00
8. E-k Diagram
175.47547547547549
00:00/00:00 -
 9. E-k Diagram
197.53086419753086
00:00/00:00
9. E-k Diagram
197.53086419753086
00:00/00:00 -
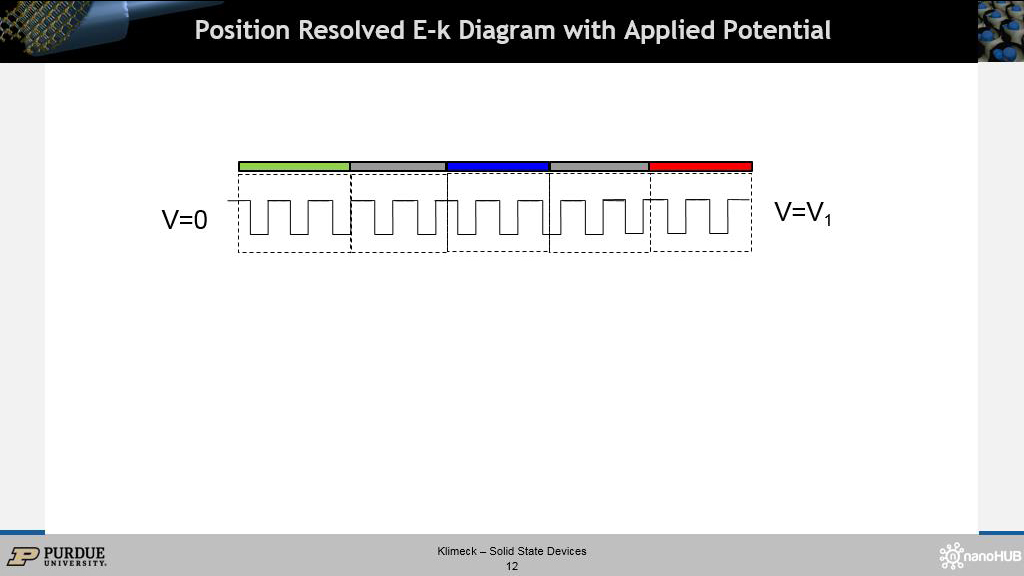
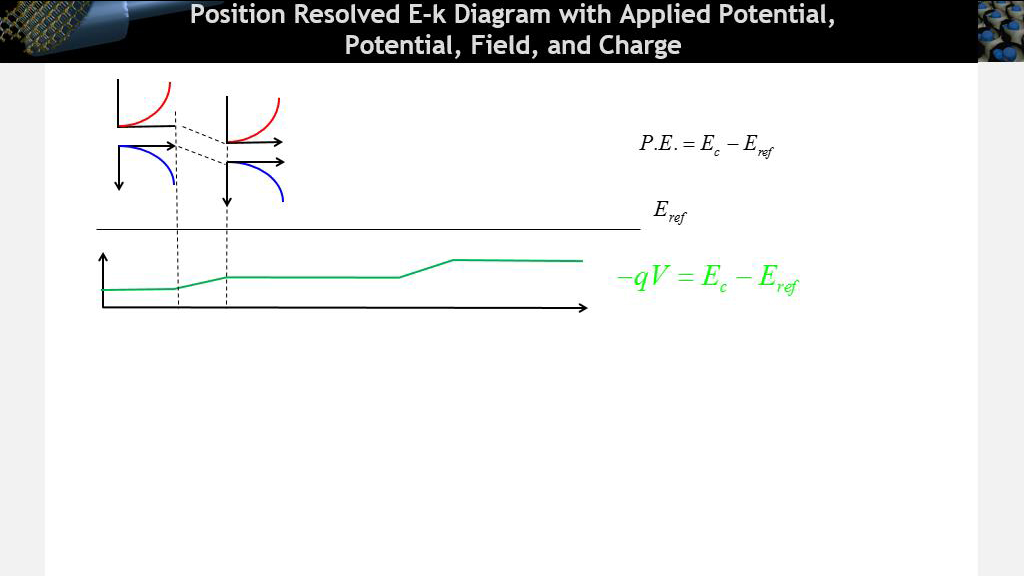
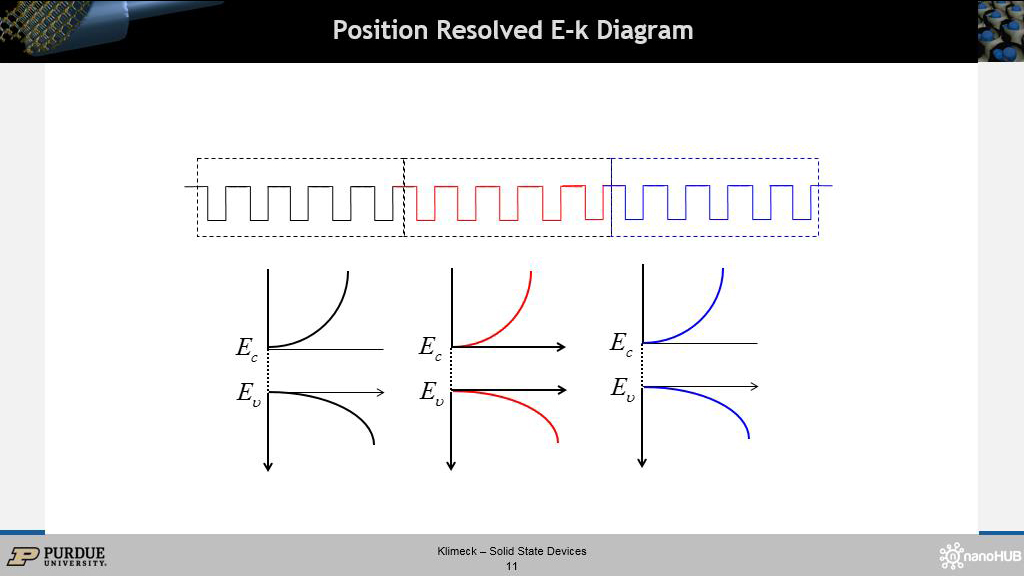 10. Position Resolved E-k Diagram
262.962962962963
00:00/00:00
10. Position Resolved E-k Diagram
262.962962962963
00:00/00:00 -
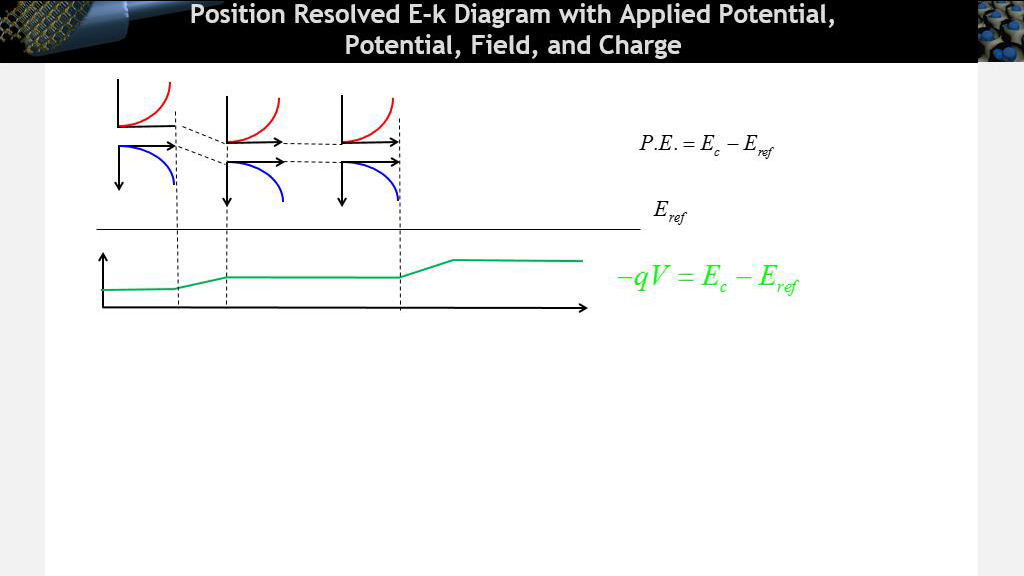
 11. Position Resolved E-k Diagram …
279.47947947947949
00:00/00:00
11. Position Resolved E-k Diagram …
279.47947947947949
00:00/00:00 -
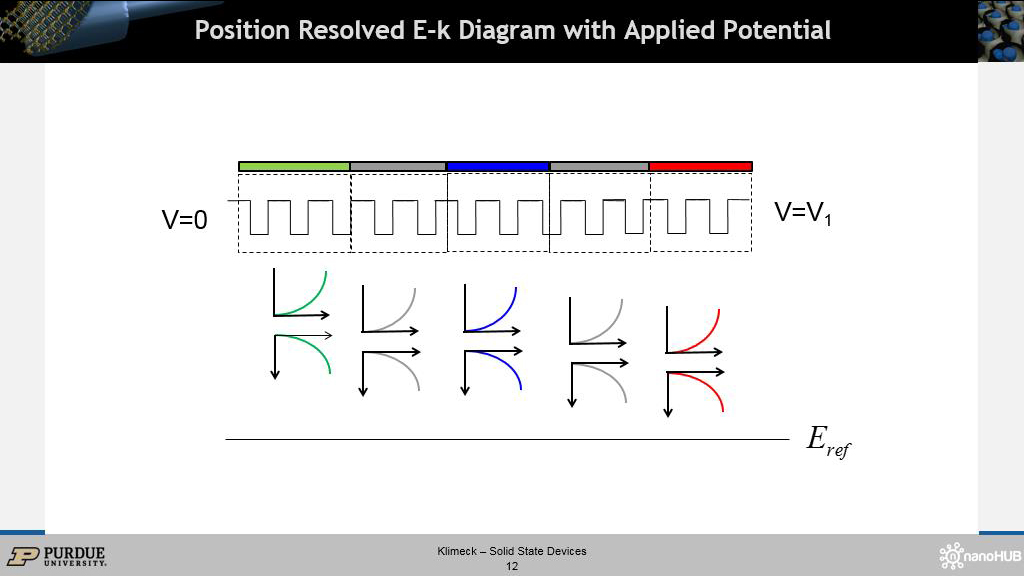
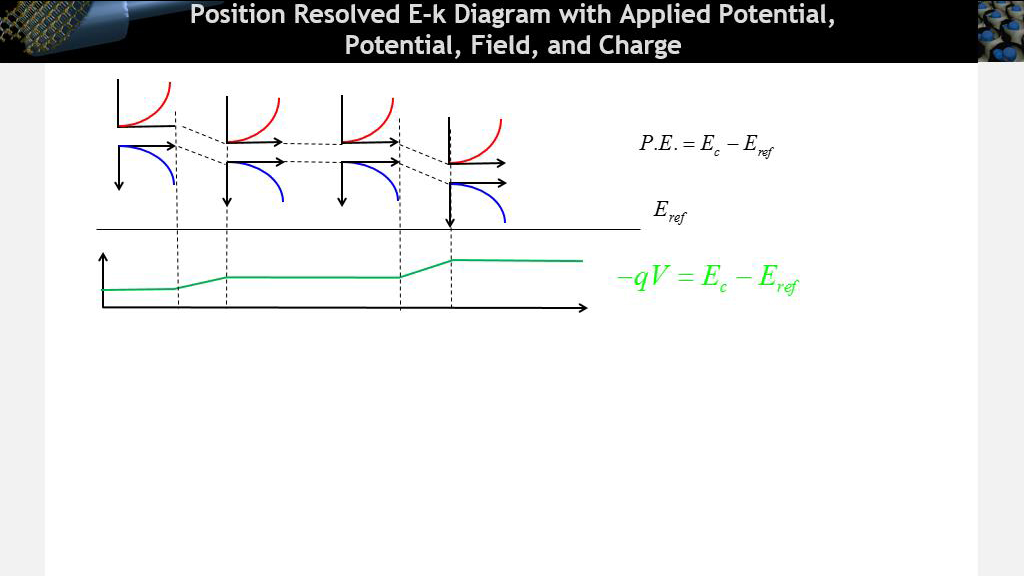
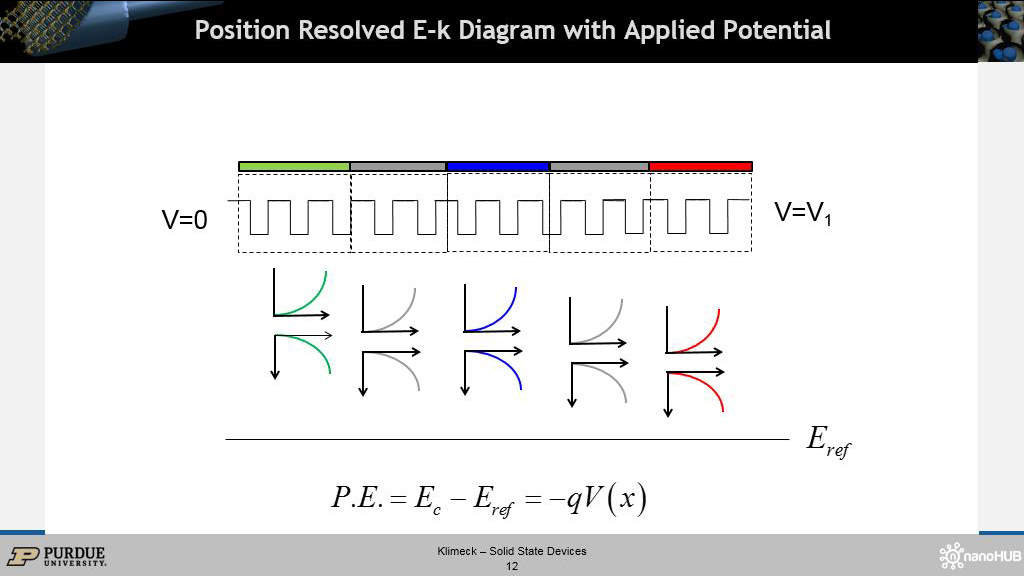
 12. Position Resolved E-k Diagram …
318.45178511845182
00:00/00:00
12. Position Resolved E-k Diagram …
318.45178511845182
00:00/00:00 -
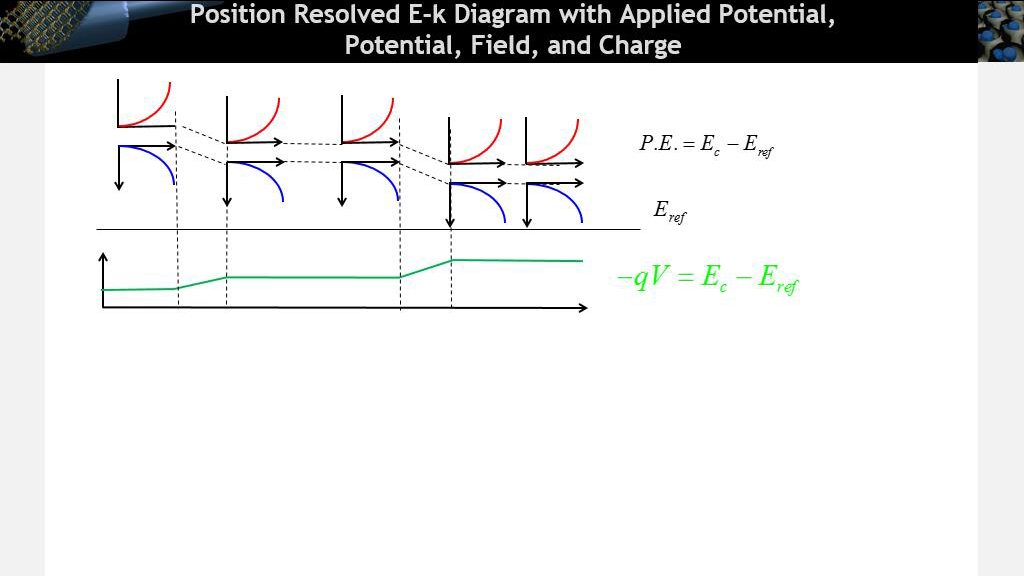
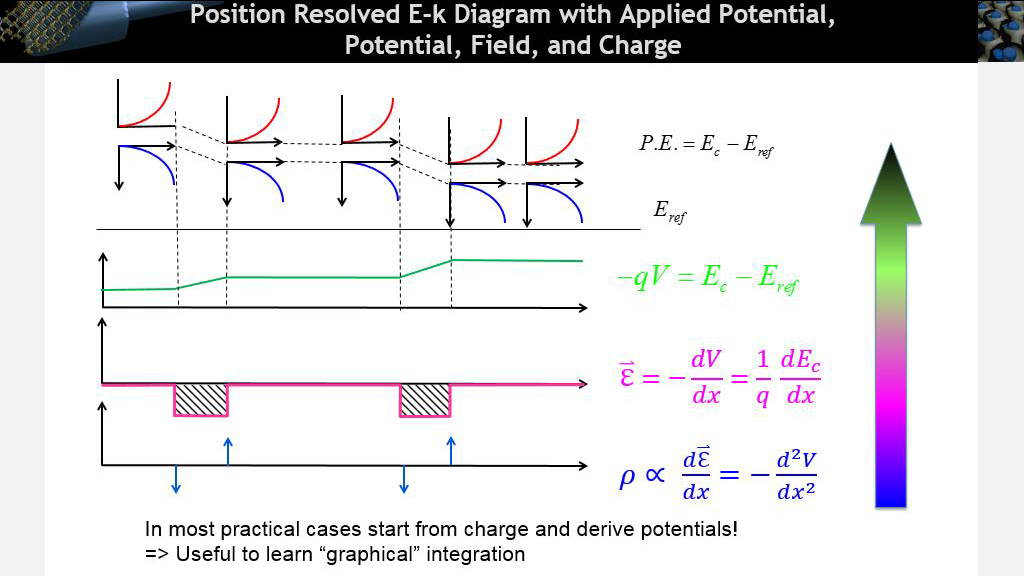
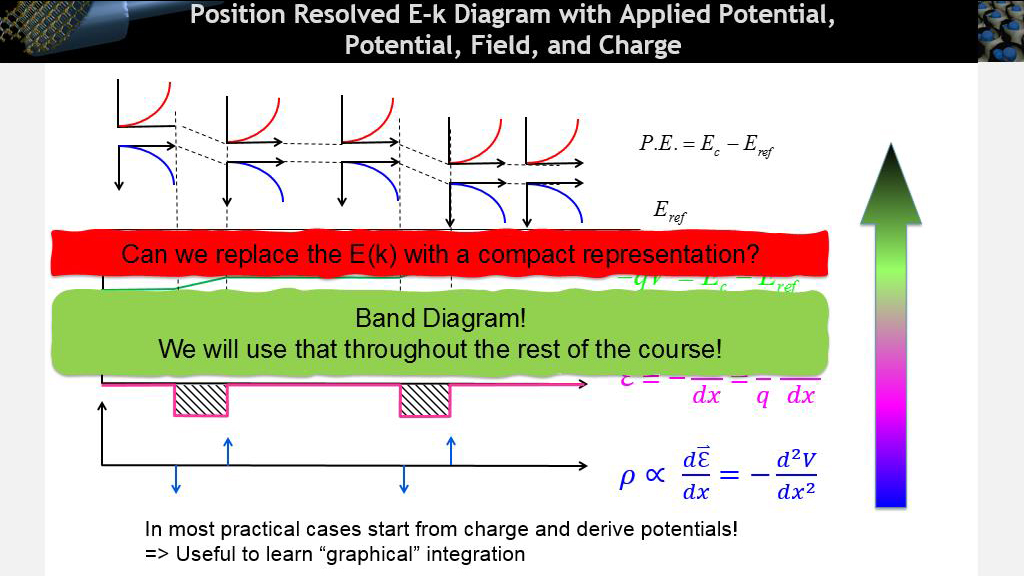 13. Position Resolved E-k Diagram …
490.89089089089089
00:00/00:00
13. Position Resolved E-k Diagram …
490.89089089089089
00:00/00:00 -
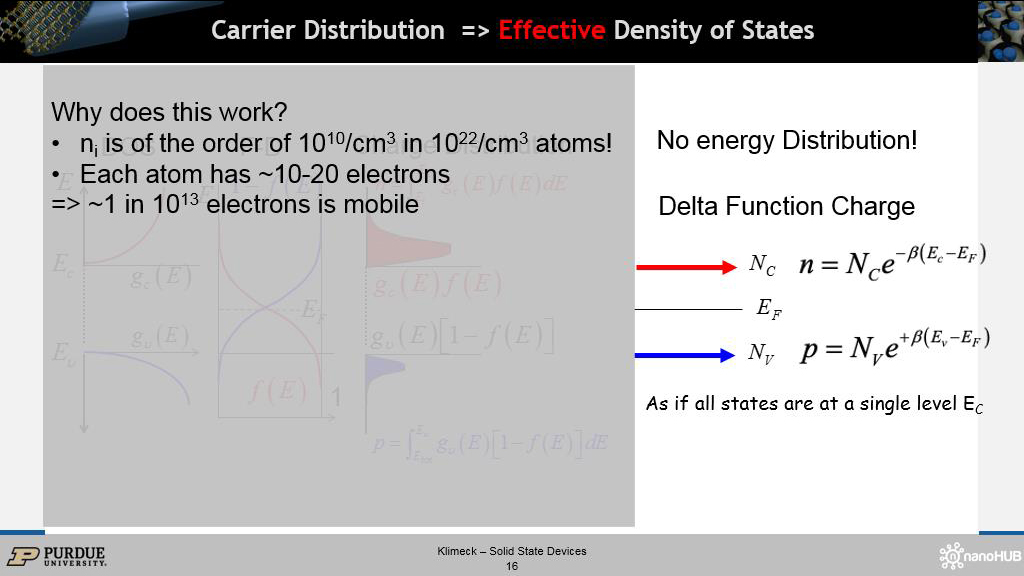
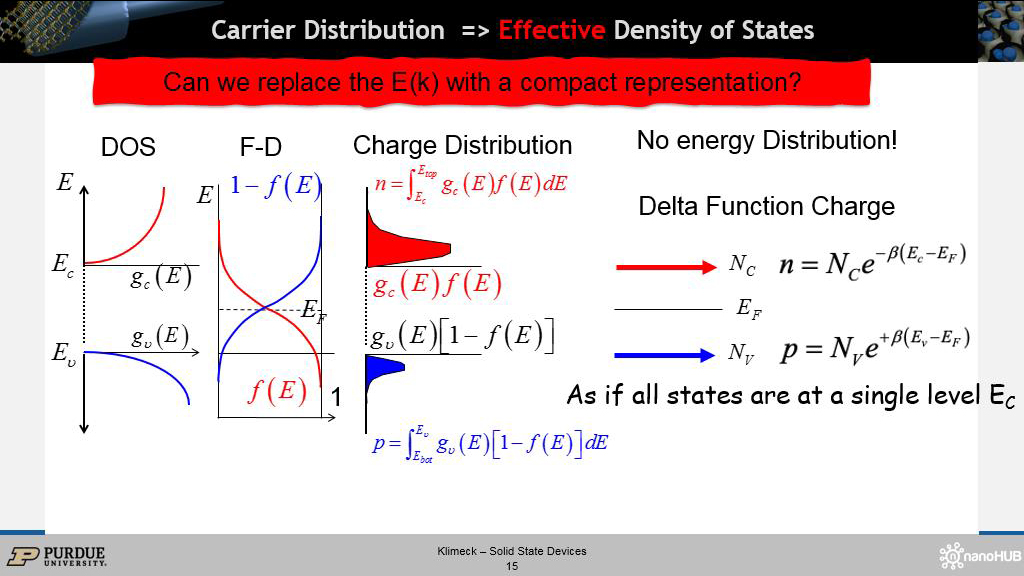 14. Carrier Distribution => Effect…
515.11511511511515
00:00/00:00
14. Carrier Distribution => Effect…
515.11511511511515
00:00/00:00 -
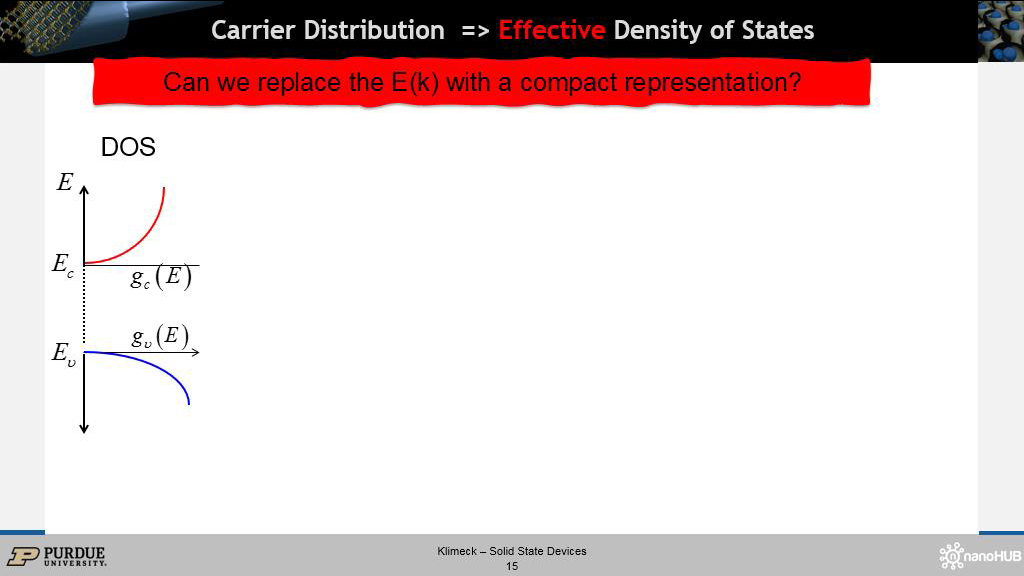
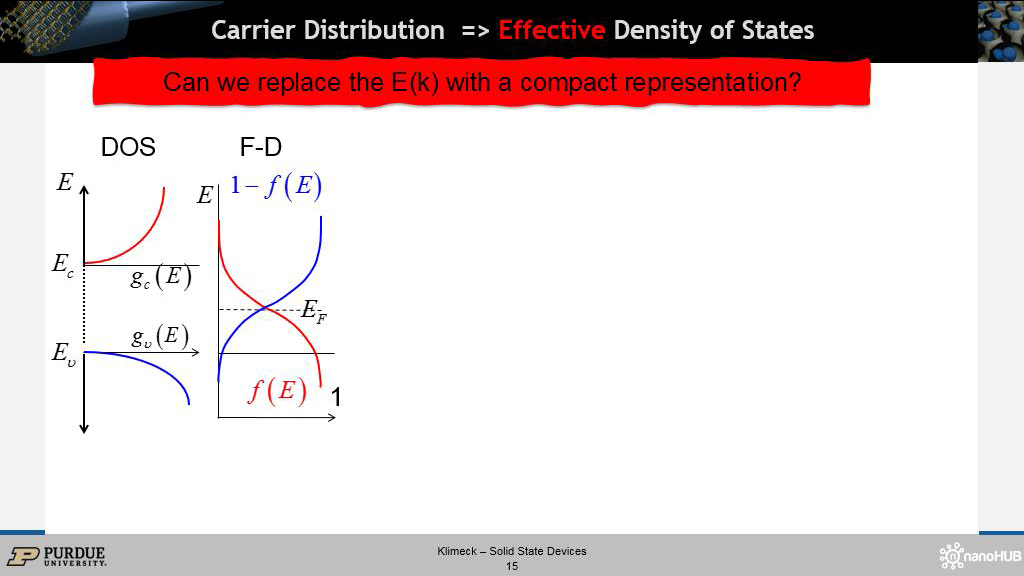
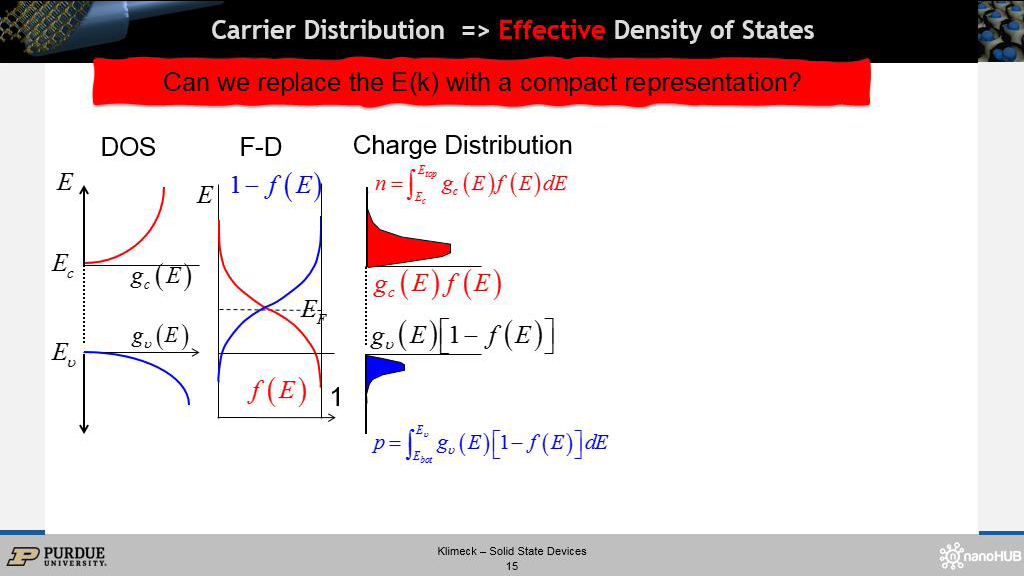
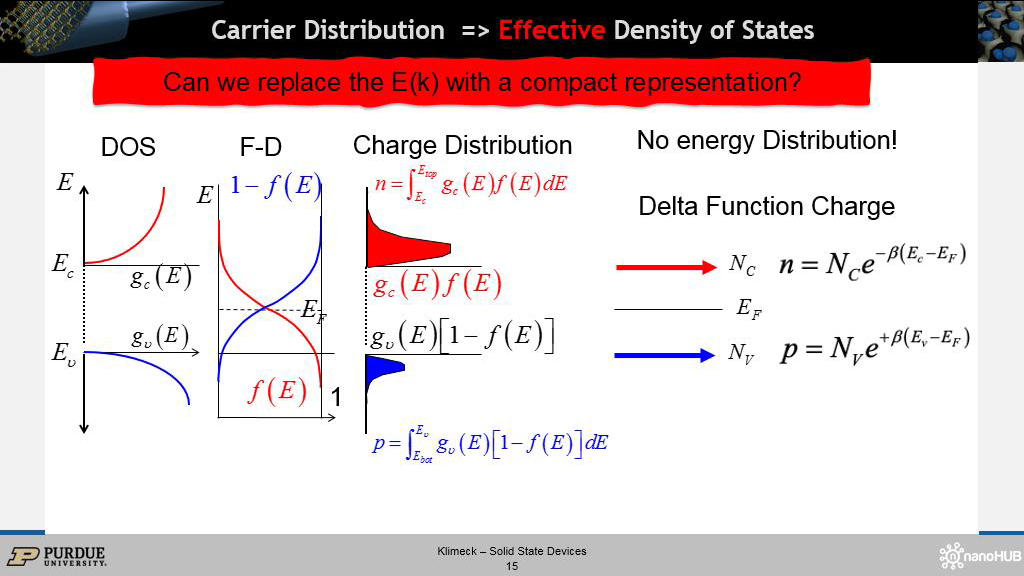
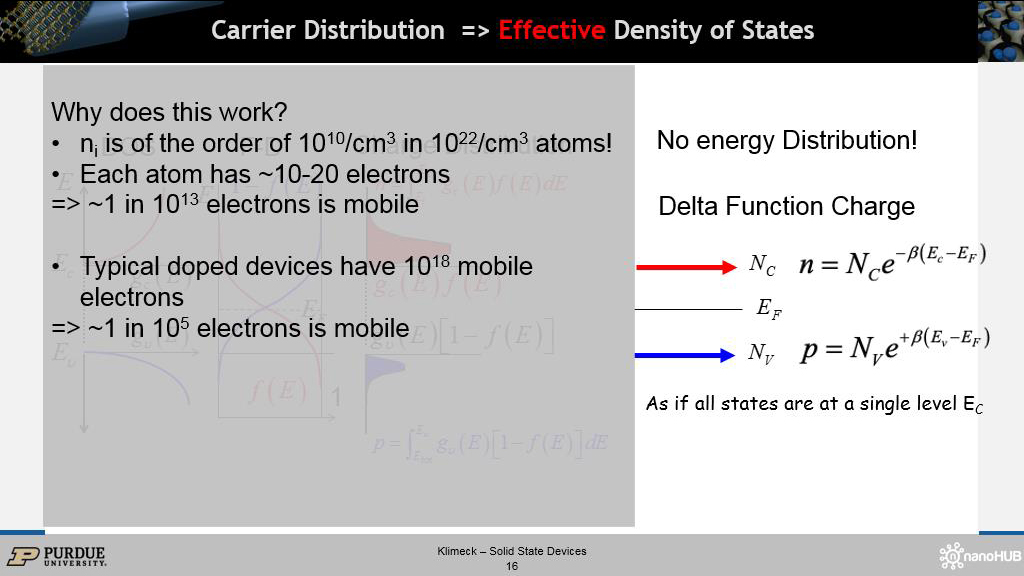
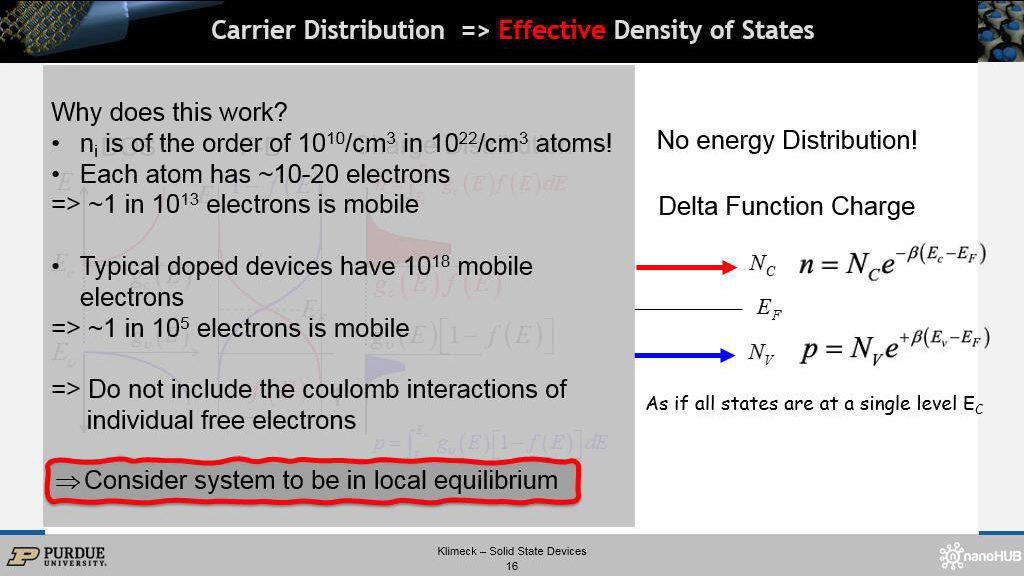 15. Carrier Distribution => Effect…
538.304971638305
00:00/00:00
15. Carrier Distribution => Effect…
538.304971638305
00:00/00:00 -
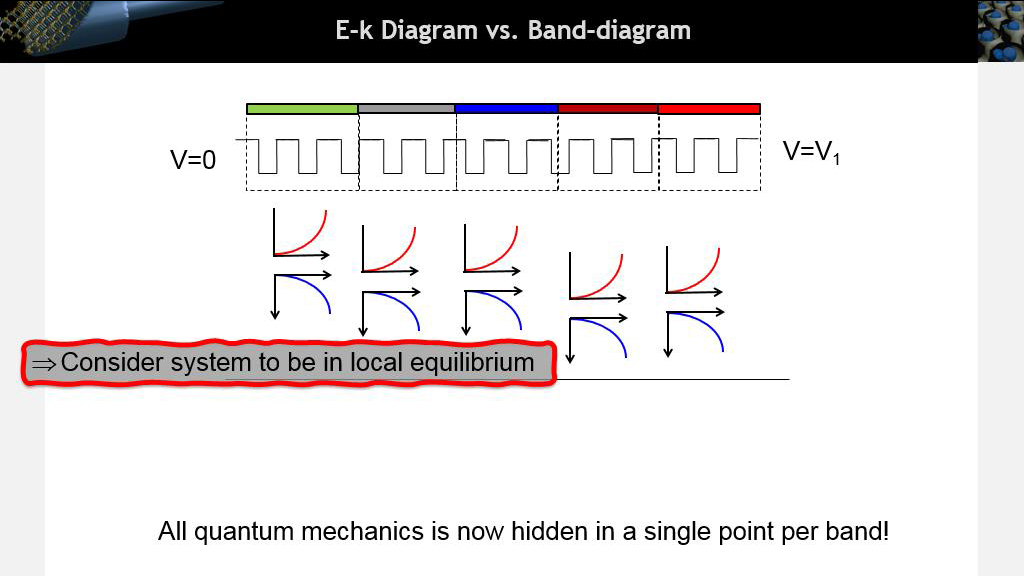
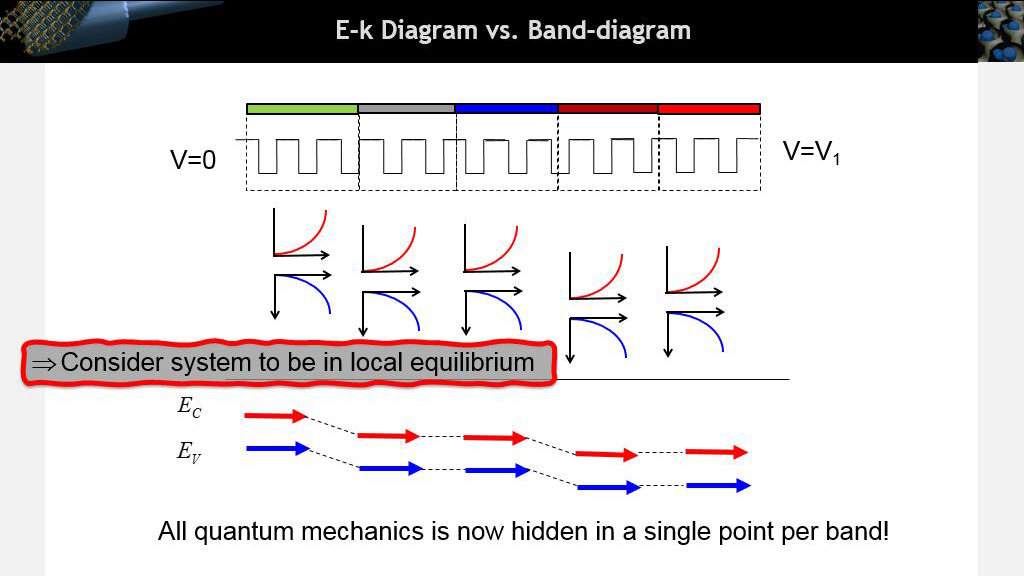 16. E-k Diagram vs. Band-diagram
646.2462462462463
00:00/00:00
16. E-k Diagram vs. Band-diagram
646.2462462462463
00:00/00:00 -
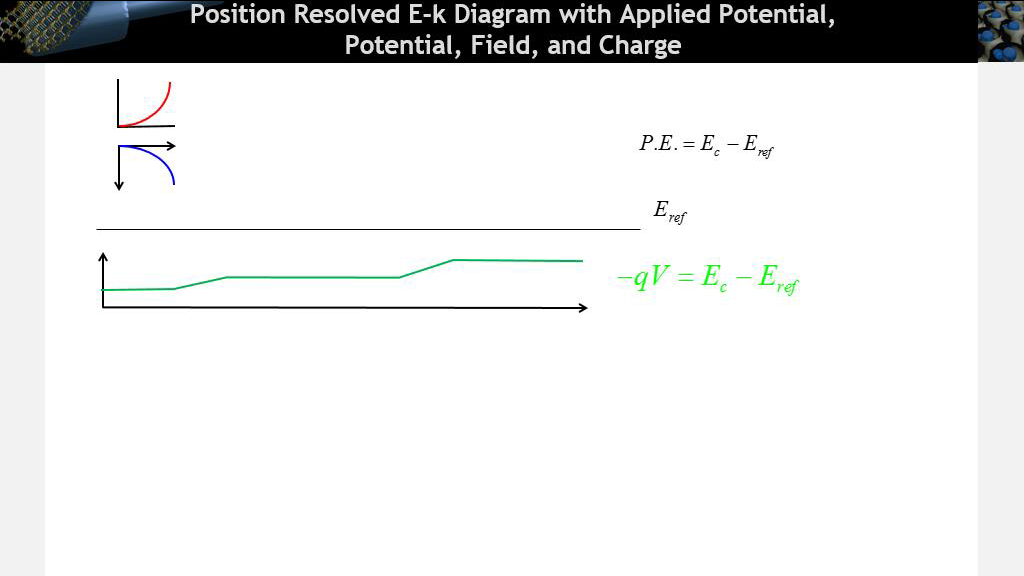
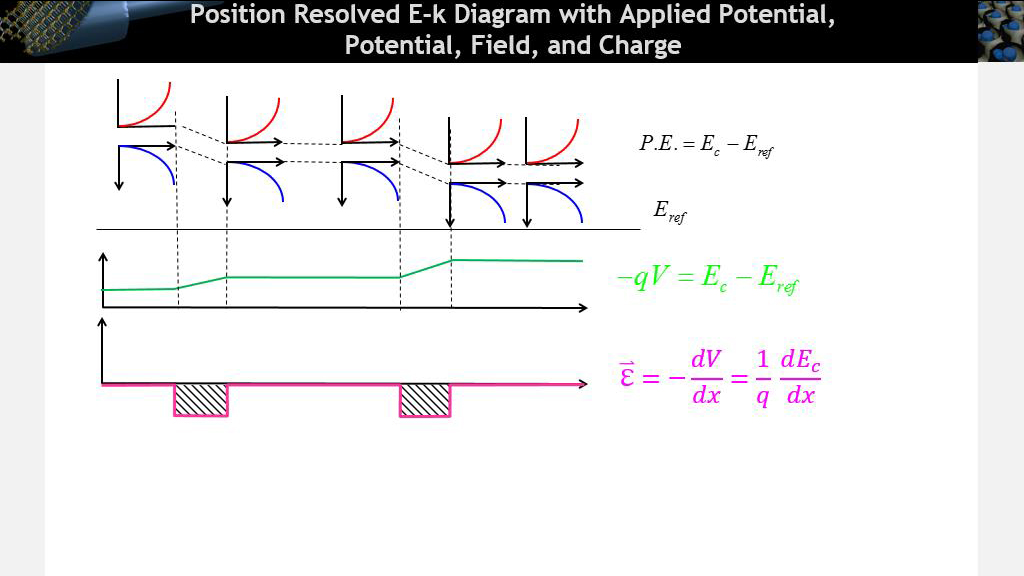
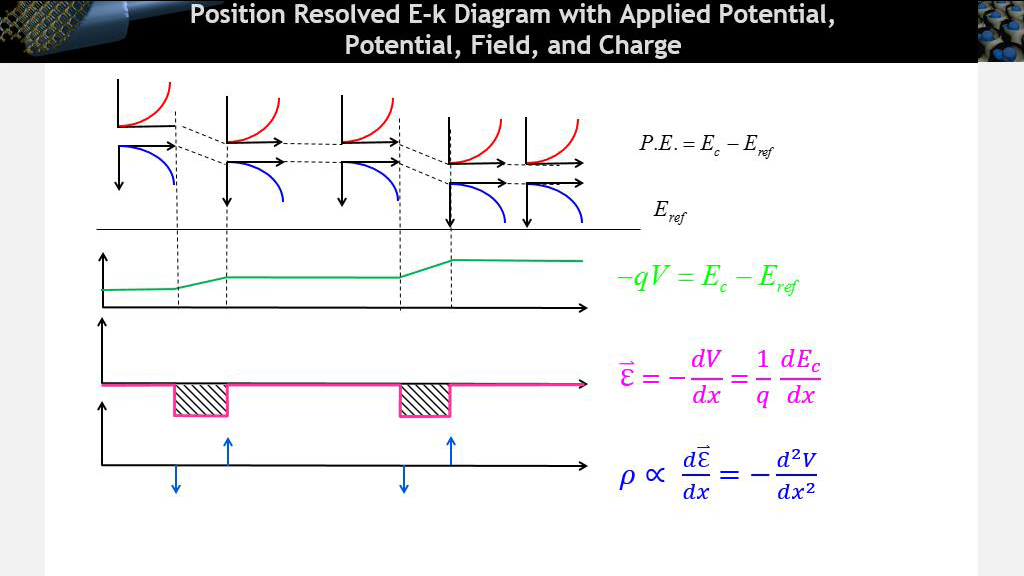
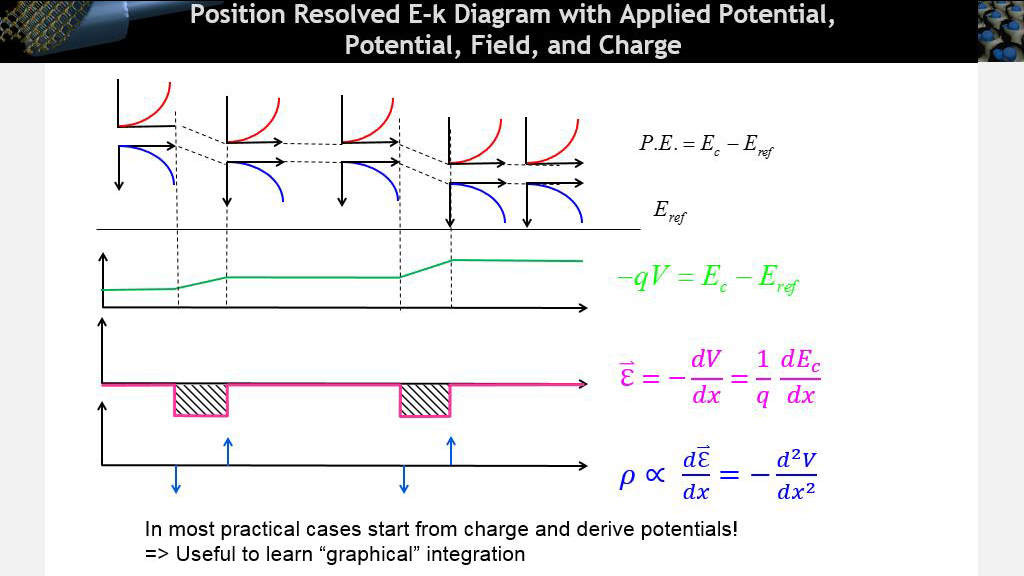
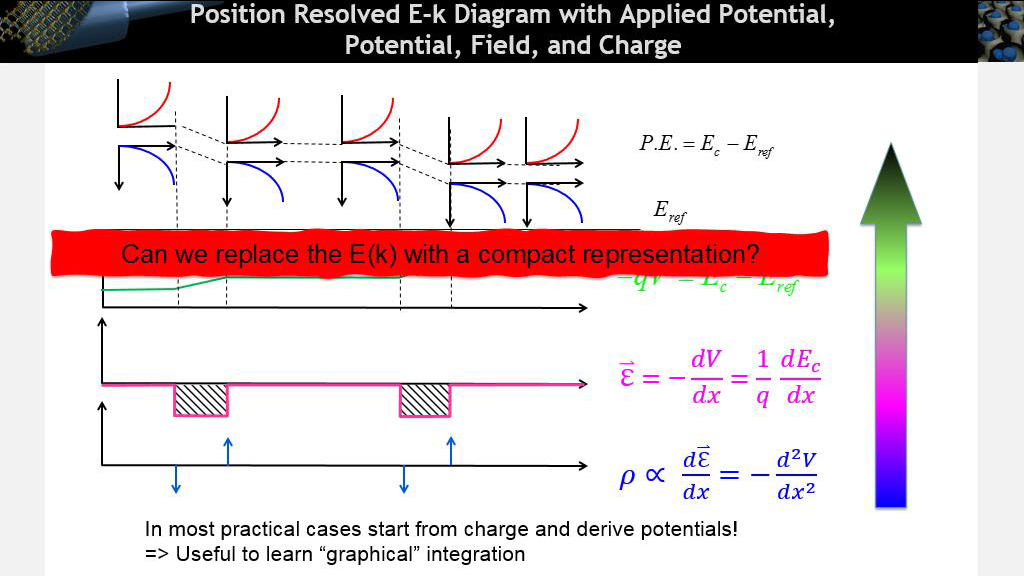
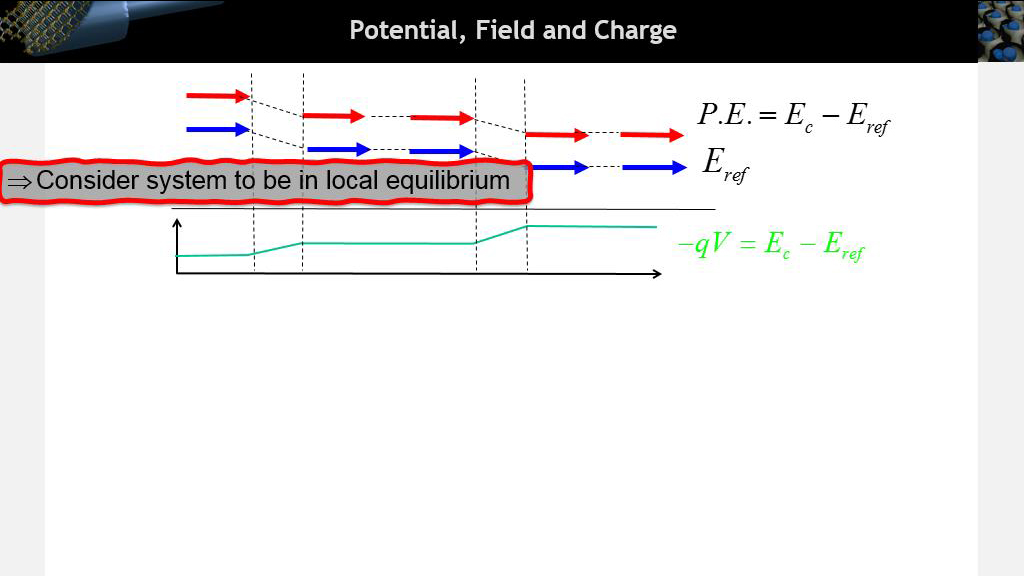
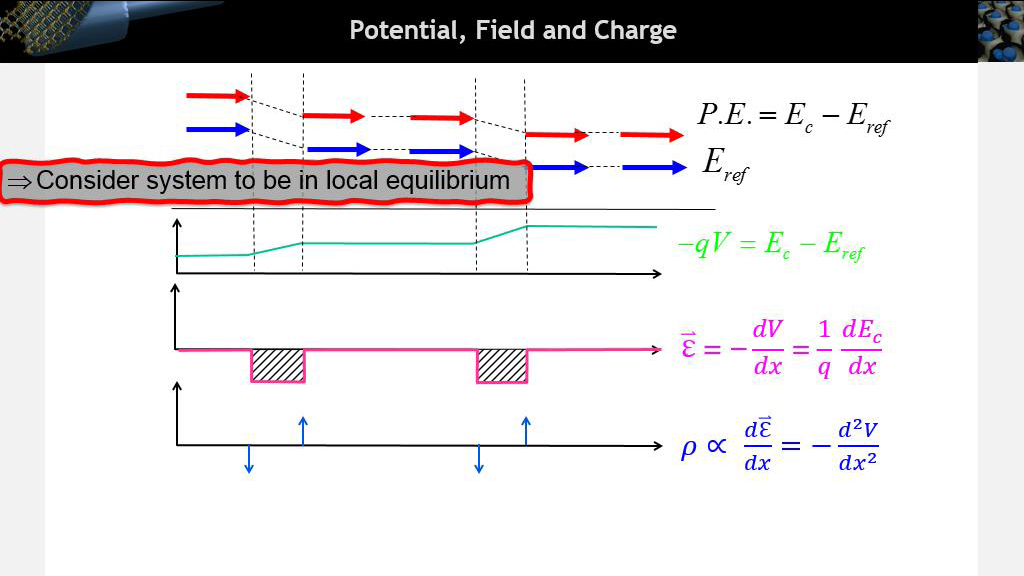
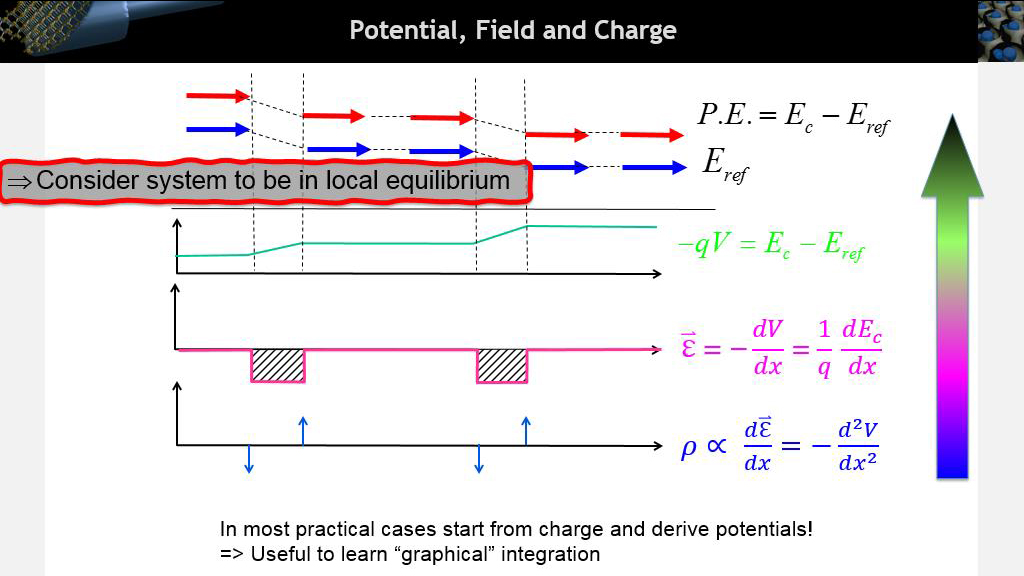 17. Potential, Field and Charge
659.39272605939277
00:00/00:00
17. Potential, Field and Charge
659.39272605939277
00:00/00:00 -
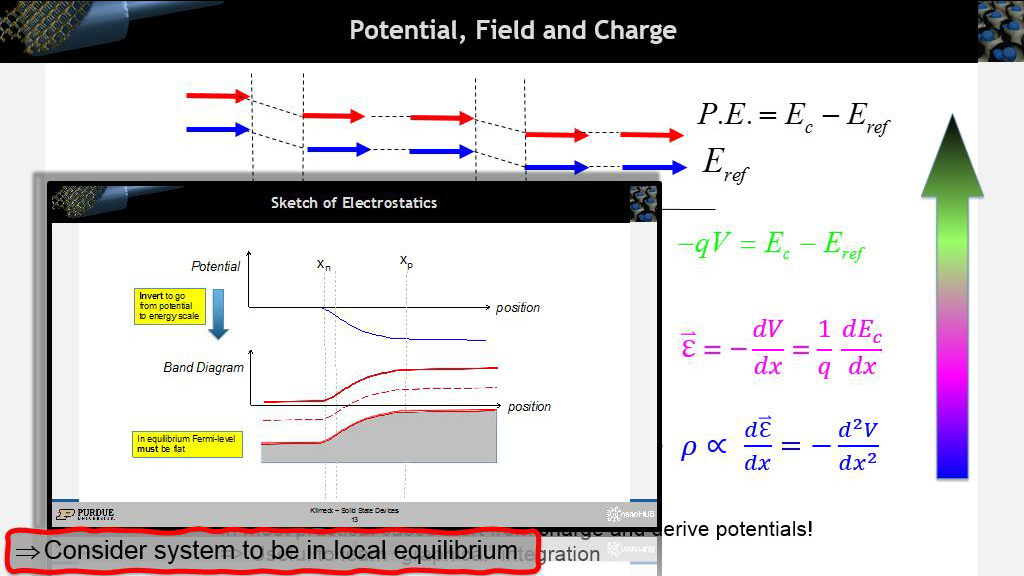 18. Potential, Field and Charge
741.74174174174175
00:00/00:00
18. Potential, Field and Charge
741.74174174174175
00:00/00:00 -
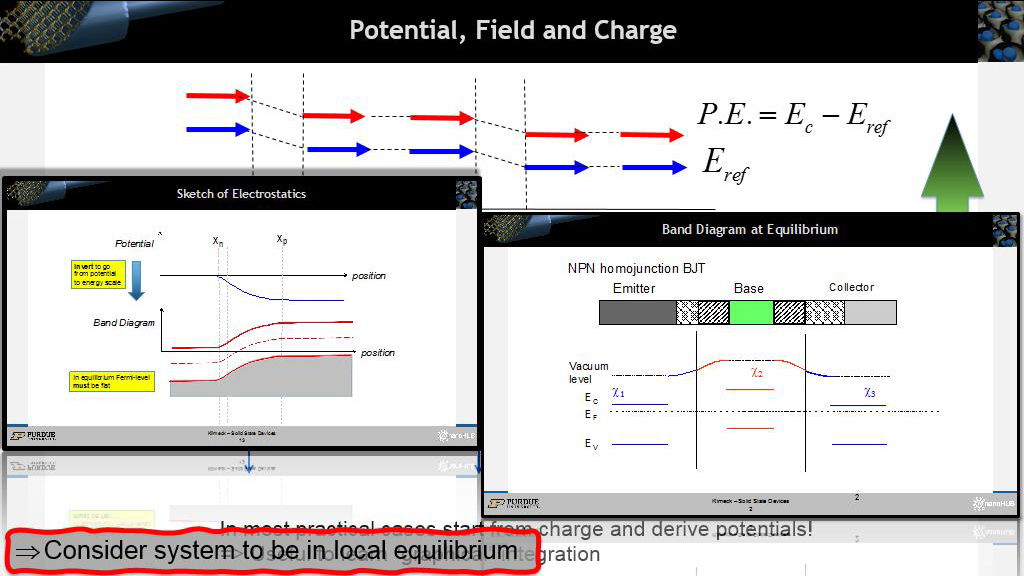 19. Potential, Field and Charge
752.78611945278612
00:00/00:00
19. Potential, Field and Charge
752.78611945278612
00:00/00:00 -
 20. Section 13 Band Diagrams
788.02135468802135
00:00/00:00
20. Section 13 Band Diagrams
788.02135468802135
00:00/00:00