You must login before you can run this tool.
Normal Distribution
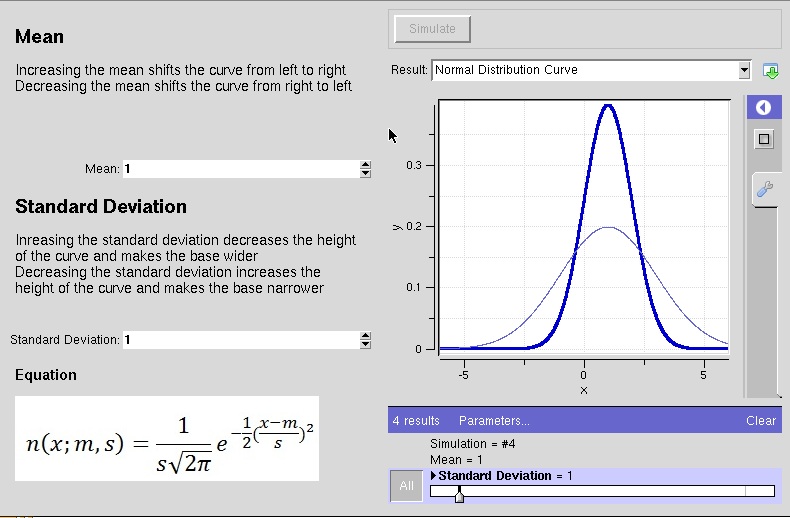
Simulate the normal distribution curve with varying mean and standard deviation


Category
Published on
Abstract
This tool will allow users to simulate the Normal Distribution Curve by changing the mean and standard deviation values. Users will see how these changes affect the height and width of the Normal Distribution Curve.
Powered by
CI4ENE
References
Madhavan, K. (2010). Histograms, Normal Distributions & Six Sigma [PDF]. Retrieved from Purdue University Blackboard Learning website https://blackboard.purdue.edu/webct/logon/8056011, McLennan, M. (2005), The Rappture Toolkit, http://rappture.org. (2011), Workspace (800x600), DOI: 10254/nanohub-r1242.1. (DOI: 10254/nanohub-r1242.1).
Cite this work
Researchers should cite this work as follows: