Understanding Variation and Statistical Process Control: Process Variation and Statistical Process Control (SPC)
Understanding Variation and Statistical Process Control: Process Variation and Statistical Process Control (SPC)
-
 1. Understanding Variation and St…
0
00:00/00:00
1. Understanding Variation and St…
0
00:00/00:00 -
 2. Outline
27.160493827160494
00:00/00:00
2. Outline
27.160493827160494
00:00/00:00 -
 3. Corning Process to Manufacture…
82.082082082082081
00:00/00:00
3. Corning Process to Manufacture…
82.082082082082081
00:00/00:00 -
 4. Measuring the Compression Laye…
319.31931931931933
00:00/00:00
4. Measuring the Compression Laye…
319.31931931931933
00:00/00:00 -
 5. Responding to Variation in the…
406.57323990657324
00:00/00:00
5. Responding to Variation in the…
406.57323990657324
00:00/00:00 -
 6. Responding to Variation in the…
585.45211878545217
00:00/00:00
6. Responding to Variation in the…
585.45211878545217
00:00/00:00 -
 7. Limits to the Process vs Speci…
639.23923923923928
00:00/00:00
7. Limits to the Process vs Speci…
639.23923923923928
00:00/00:00 -
 8. Limits to the Process vs Speci…
792.79279279279285
00:00/00:00
8. Limits to the Process vs Speci…
792.79279279279285
00:00/00:00 -
 9. Histogram of the Glass Strain …
829.7630964297631
00:00/00:00
9. Histogram of the Glass Strain …
829.7630964297631
00:00/00:00 -
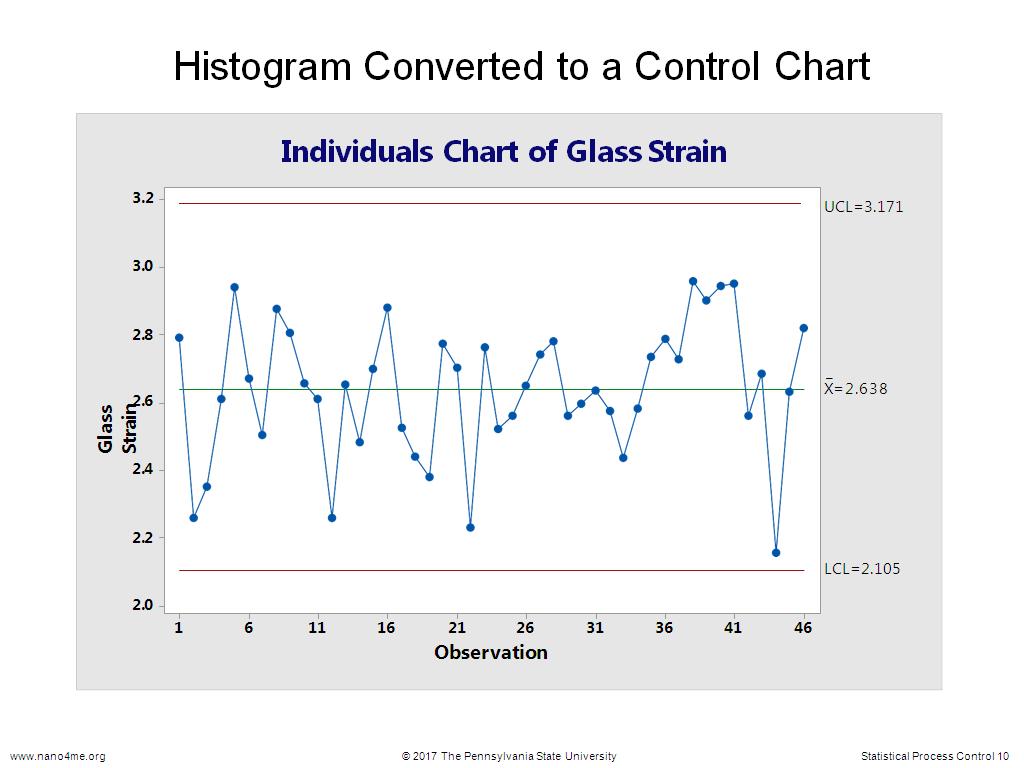 10. Histogram Converted to a Contr…
960.593927260594
00:00/00:00
10. Histogram Converted to a Contr…
960.593927260594
00:00/00:00 -
 11. Characteristics of a Control C…
1050.4838171504839
00:00/00:00
11. Characteristics of a Control C…
1050.4838171504839
00:00/00:00 -
 12. Sources of Variation – Time …
1154.421087754421
00:00/00:00
12. Sources of Variation – Time …
1154.421087754421
00:00/00:00 -
 13. Sources of Variation – Commo…
1386.8535201868535
00:00/00:00
13. Sources of Variation – Commo…
1386.8535201868535
00:00/00:00 -
 14. Identifying Special Cause Vari…
1556.1895228561896
00:00/00:00
14. Identifying Special Cause Vari…
1556.1895228561896
00:00/00:00 -
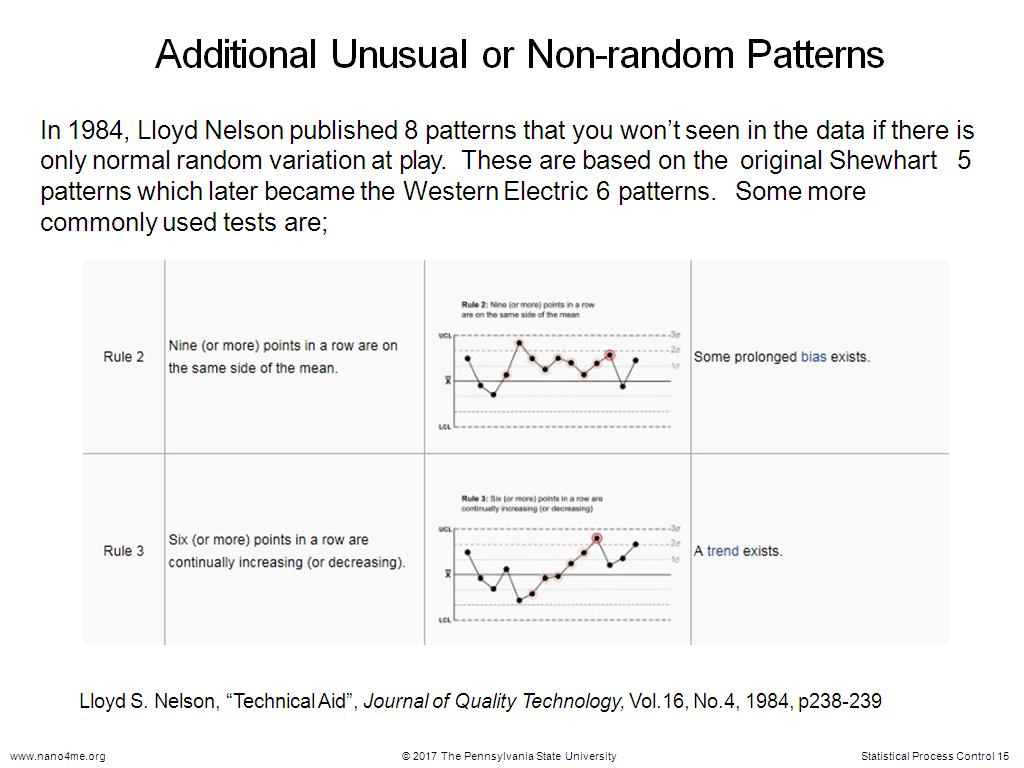 15. Additional Unusual or Non-rand…
1647.6810143476812
00:00/00:00
15. Additional Unusual or Non-rand…
1647.6810143476812
00:00/00:00 -
 16. Additional Unusual or Non-rand…
1864.964964964965
00:00/00:00
16. Additional Unusual or Non-rand…
1864.964964964965
00:00/00:00 -
 17. Determining Patterns from Spec…
1965.0984317650984
00:00/00:00
17. Determining Patterns from Spec…
1965.0984317650984
00:00/00:00 -
 18. Eight Tests for Special Cause …
2144.4110777444112
00:00/00:00
18. Eight Tests for Special Cause …
2144.4110777444112
00:00/00:00 -
 19. Identifying Special Cause Vari…
2330.4304304304305
00:00/00:00
19. Identifying Special Cause Vari…
2330.4304304304305
00:00/00:00 -
 20. Identifying Special Cause Vari…
2352.9863196529864
00:00/00:00
20. Identifying Special Cause Vari…
2352.9863196529864
00:00/00:00 -
 21. Dry Etch Process for Microproc…
2404.0040040040039
00:00/00:00
21. Dry Etch Process for Microproc…
2404.0040040040039
00:00/00:00 -
 22. Value of Collecting Subgroup D…
2568.9356022689358
00:00/00:00
22. Value of Collecting Subgroup D…
2568.9356022689358
00:00/00:00 -
 23. X-bar & R Chart of the Process
2714.9149149149152
00:00/00:00
23. X-bar & R Chart of the Process
2714.9149149149152
00:00/00:00 -
 24. Identification of Out-of Contr…
2852.5525525525527
00:00/00:00
24. Identification of Out-of Contr…
2852.5525525525527
00:00/00:00 -
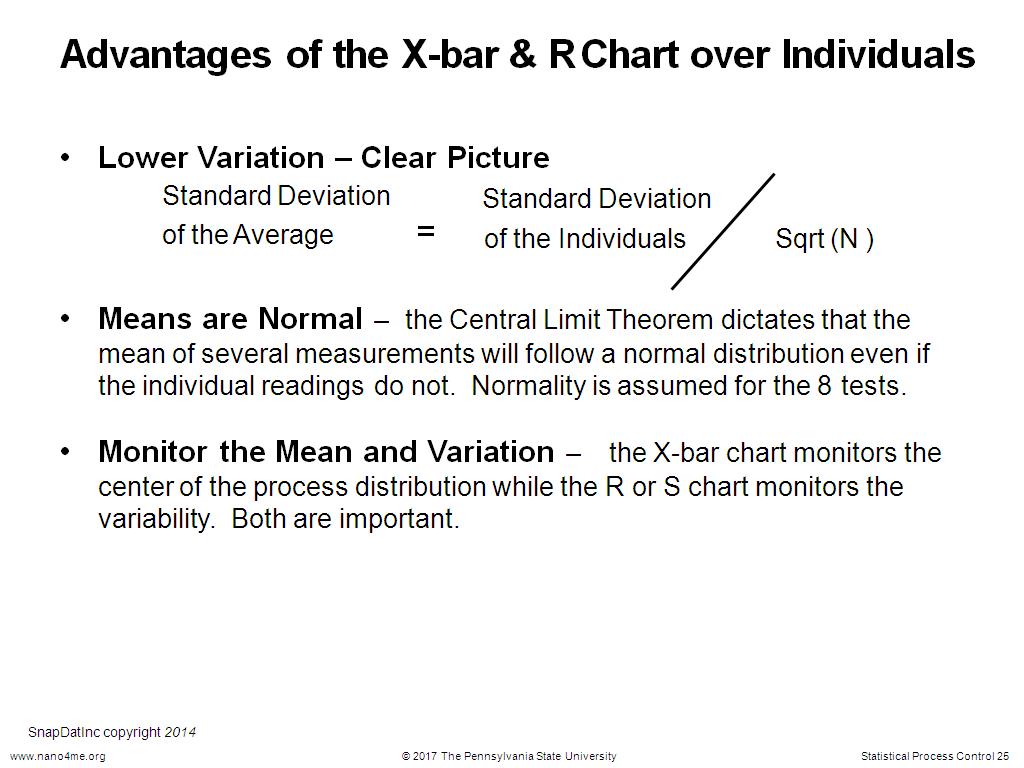 25. Advantages of the X-bar & R Ch…
2891.1911911911911
00:00/00:00
25. Advantages of the X-bar & R Ch…
2891.1911911911911
00:00/00:00 -
 26. When to use the I- Chart
3105.7724391057727
00:00/00:00
26. When to use the I- Chart
3105.7724391057727
00:00/00:00 -
 27. The Xbar and S Chart
3201.901901901902
00:00/00:00
27. The Xbar and S Chart
3201.901901901902
00:00/00:00 -
 28. When to use the S Chart
3265.4654654654655
00:00/00:00
28. When to use the S Chart
3265.4654654654655
00:00/00:00 -
 29. Conclusions
3388.4217550884218
00:00/00:00
29. Conclusions
3388.4217550884218
00:00/00:00 -
 30. References
3506.3063063063064
00:00/00:00
30. References
3506.3063063063064
00:00/00:00