Understanding Variation and Statistical Process Control: Variation and Process Capability Calculations
Understanding Variation and Statistical Process Control: Variation and Process Capability Calculations
-
 1. Understanding Variation and St…
0
00:00/00:00
1. Understanding Variation and St…
0
00:00/00:00 -
 2. Outline
48.882215548882215
00:00/00:00
2. Outline
48.882215548882215
00:00/00:00 -
 3. New Face of Quality – Low Va…
100.96763430096763
00:00/00:00
3. New Face of Quality – Low Va…
100.96763430096763
00:00/00:00 -
 4. Data from the Process Provides…
383.75041708375045
00:00/00:00
4. Data from the Process Provides…
383.75041708375045
00:00/00:00 -
 5. A Histogram Outlines the Diame…
439.17250583917252
00:00/00:00
5. A Histogram Outlines the Diame…
439.17250583917252
00:00/00:00 -
 6. A Normal Distribution defines …
612.14547881214548
00:00/00:00
6. A Normal Distribution defines …
612.14547881214548
00:00/00:00 -
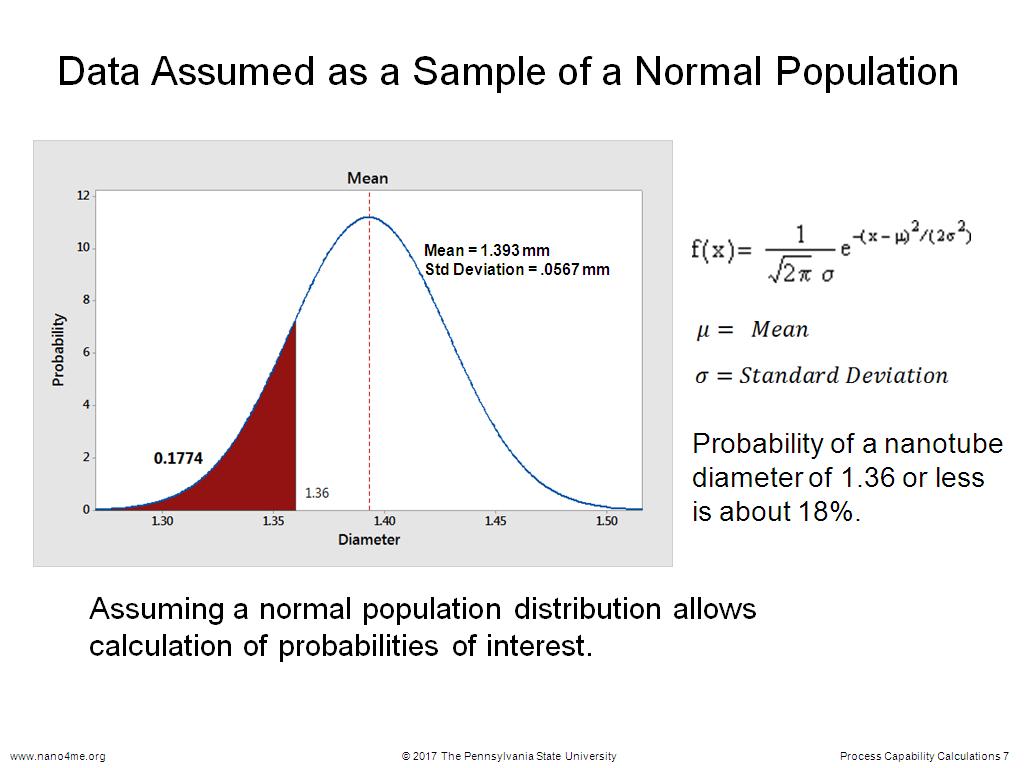 7. Data Assumed as a Sample of a …
776.67667667667672
00:00/00:00
7. Data Assumed as a Sample of a …
776.67667667667672
00:00/00:00 -
 8. Assuming a Normal Distribution…
895.89589589589593
00:00/00:00
8. Assuming a Normal Distribution…
895.89589589589593
00:00/00:00 -
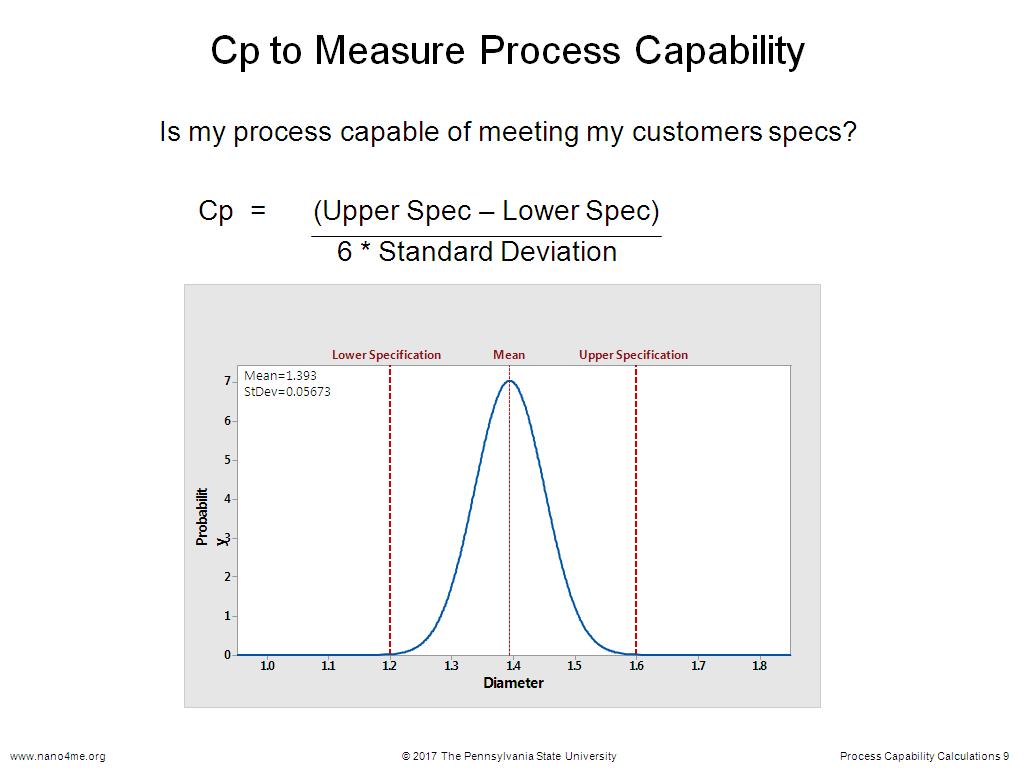 9. Cp to Measure Process Capabili…
1038.2716049382716
00:00/00:00
9. Cp to Measure Process Capabili…
1038.2716049382716
00:00/00:00 -
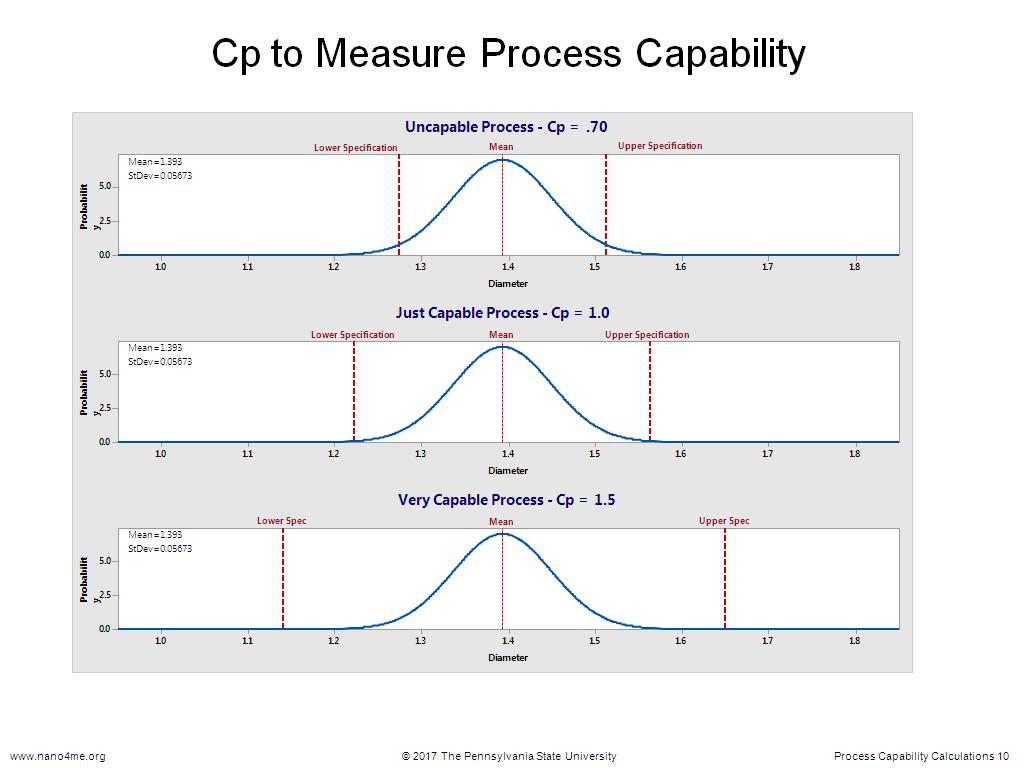 10. Cp to Measure Process Capabili…
1231.3646980313647
00:00/00:00
10. Cp to Measure Process Capabili…
1231.3646980313647
00:00/00:00 -
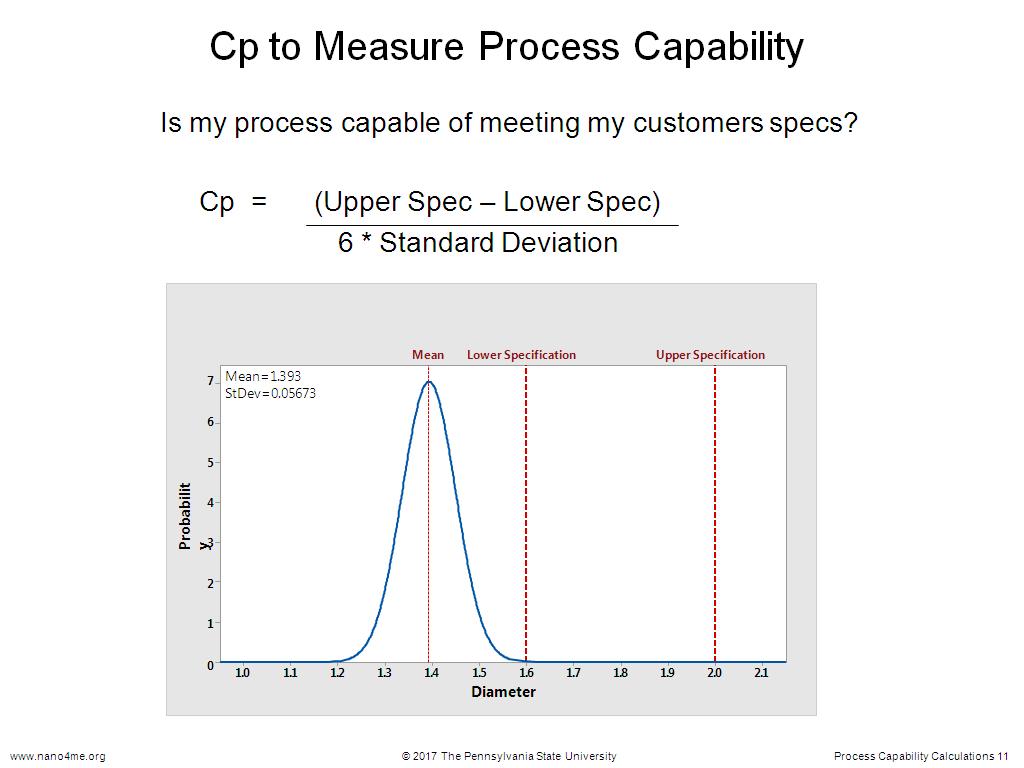 11. Cp to Measure Process Capabili…
1335.3353353353355
00:00/00:00
11. Cp to Measure Process Capabili…
1335.3353353353355
00:00/00:00 -
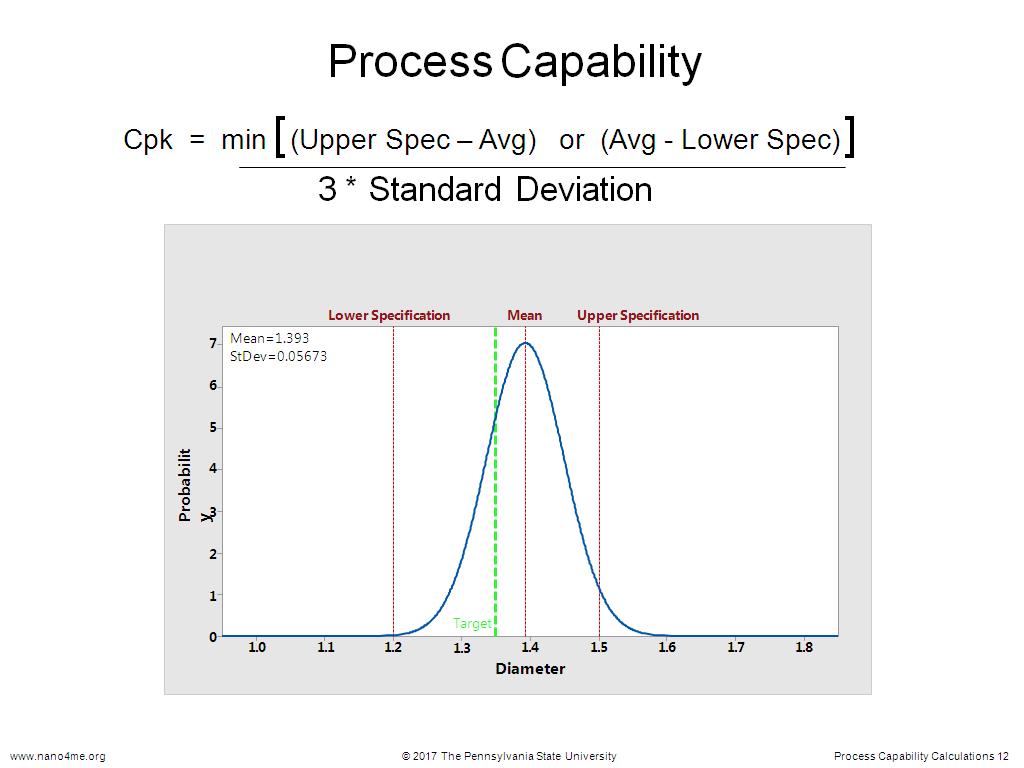 12. Process Capability
1422.7227227227227
00:00/00:00
12. Process Capability
1422.7227227227227
00:00/00:00 -
 13. Process Capability Calculation…
1538.9389389389389
00:00/00:00
13. Process Capability Calculation…
1538.9389389389389
00:00/00:00 -
 14. Process Capability
1725.3586920253588
00:00/00:00
14. Process Capability
1725.3586920253588
00:00/00:00 -
 15. Data for Long-term Process Cap…
1983.1498164831498
00:00/00:00
15. Data for Long-term Process Cap…
1983.1498164831498
00:00/00:00 -
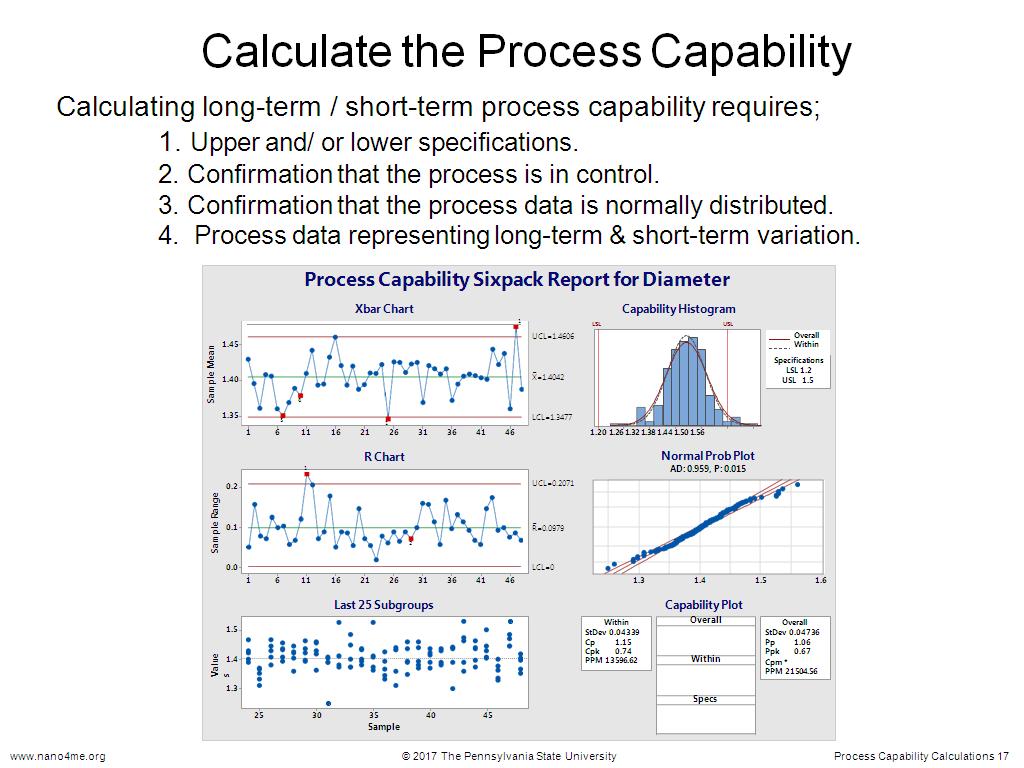 16. Calculate the Process Capabili…
2061.8284951618284
00:00/00:00
16. Calculate the Process Capabili…
2061.8284951618284
00:00/00:00 -
 17. Interpretation of Capability O…
2310.1101101101103
00:00/00:00
17. Interpretation of Capability O…
2310.1101101101103
00:00/00:00 -
 18. Relationship Between Cpk vs Pp…
2433.9673006339672
00:00/00:00
18. Relationship Between Cpk vs Pp…
2433.9673006339672
00:00/00:00 -
 19. Acceptable Cpk Levels
2554.6880213546883
00:00/00:00
19. Acceptable Cpk Levels
2554.6880213546883
00:00/00:00 -
 20. Conclusions
2715.2485819152489
00:00/00:00
20. Conclusions
2715.2485819152489
00:00/00:00